This protocol demonstrates how to generate fluorescently marked, genetically defined clonal tumors in the Drosophila eye/antennal imaginal discs (EAD). It describes how to dissect the EAD and brain from the third instar larvae and how to process them to visualize and quantify gene expression changes and tumor invasiveness.
Drosophila melanogaster has emerged as a powerful experimental system for functional and mechanistic studies of tumor development and progression in the context of a whole organism. Sophisticated techniques to generate genetic mosaics facilitate induction of visually marked, genetically defined clones surrounded by normal tissue. The clones can be analyzed through diverse molecular, cellular and omics approaches. This study describes how to generate fluorescently labeled clonal tumors of varying malignancy in the eye/antennal imaginal discs (EAD) of Drosophila larvae using the Mosaic Analysis with a Repressible Cell Marker (MARCM) technique. It describes procedures how to recover the mosaic EAD and brain from the larvae and how to process them for simultaneous imaging of fluorescent transgenic reporters and antibody staining. To facilitate molecular characterization of the mosaic tissue, we describe a protocol for isolation of total RNA from the EAD. The dissection procedure is suitable to recover EAD and brains from any larval stage. The fixation and staining protocol for imaginal discs works with a number of transgenic reporters and antibodies that recognize Drosophila proteins. The protocol for RNA isolation can be applied to various larval organs, whole larvae, and adult flies. Total RNA can be used for profiling of gene expression changes using candidate or genome-wide approaches. Finally, we detail a method for quantifying invasiveness of the clonal tumors. Although this method has limited use, its underlying concept is broadly applicable to other quantitative studies where cognitive bias must be avoided.
Cancer represents one of the most genetically heterogeneous group of diseases, whose incidence and mortality is dramatically increasing, particularly among the elderly worldwide. Cancer originates clonally from a tumor-initiating cell that escapes inherent tumor suppressor mechanisms and divides out of control. The gradual accumulation of genetic lesions that cooperatively promote growth, proliferation and motility while inhibiting death and differentiation transforms the initial benign overgrowth into a highly malignant, metastatic and deadly tumor. It has become evident that in addition to genetic alterations, tumor progression requires changes in the surrounding stroma and crosstalk between the tumor and multiple cell types (e.g., fibroblasts, immune and endothelial cells) in its microenvironment. Understanding the molecular principles underlying malignant transformation including tumor-stroma interactions is of great importance for developing prevention and early screening strategies, as well as new and effective treatments to combat cancer metastasis and drug resistance.
The fruit fly Drosophila melanogaster has become an attractive system for cancer research 1-4 owing to its fast generation time, remarkable conservation of signaling nodes between flies and humans, limited genetic redundancy and wealth of advanced genetic tools that facilitate manipulation of almost any gene in a temporarily and spatially restricted manner. Genetically defined tumors of varying malignancy can be reproducibly engineered in Drosophila by introducing gain- and loss-of-function mutations in a subset of progenitors in an otherwise wild type tissue using the MARCM technique 5. The MARCM tool combines FLP/FRT (FLP recombinase/FLP Recognition Target)-mediated mitotic recombination 6 with FLP-out 7 and Gal4/UAS (Upstream Activation Sequence) 8 target gene expression systems 9. With this method expression of any UAS-based transgene, including oncogene or fluorescent protein cDNAs or inverted DNA repeats for dsRNA-induced gene silencing, will be restricted to a clone of cells that have lost a specific genetic locus and a Gal4 repressor due to recombination (Figure 1A). Clonal patches marked with green fluorescent (GFP) or red fluorescent proteins (e.g., RFP, DsRed, mCherry) can be easily tracked throughout development, isolated and analyzed. Importantly, their behavior can be directly compared to the adjacent wild type tissue. Thus, questions pertinent to the cell autonomous and non-autonomous effects of genetic lesions can be conveniently studied. Similar to mammals, only clones in which multiple oncogenic lesions are combined become malignant in Drosophila and recapitulate key hallmarks of mammalian cancer. They overproliferate, evade apoptosis, induce inflammation, become immortal and invasive, ultimately killing the host 10-17.
Here, we describe a protocol to generate genetically defined clonal tumors in the eye/antennal and brain tissue of Drosophila larvae using the MARCM technique. The method relies on a MARCM tester stock which expresses the yeast FLP recombinase under the control of the eyeless enhancer (eyFLP) 18,19. In this way, GFP-labeled clones are generated in both peripodial and columnar epithelium of the EAD and the neuroepithelium of the brain throughout embryonic and larval stages (Figure 1A, B and reference 20). Clones can be easily followed until adulthood as the EAD develops into the adult eye, antenna and head capsule while the neuroepithelium gives rise to neuroblasts that produce differentiated optic lobe neurons.
To facilitate extensive molecular, functional and phenotypic characterization of the mosaic tissue, we describe a protocol for dissection of the EAD and brain from the third instar larvae and outline how to process them for three different applications: (i) detection of transgenic fluorescent reporters and immunostaining, (ii) quantification of tumor invasiveness and (iii) analysis of gene expression changes using a quantitative real-time PCR (qRT-PCR) or a high-throughput mRNA sequencing (mRNA-seq) (Figure 1C).
The immunostaining protocol can be used to visualize any protein of interest with a specific antibody. Transgenic fluorescent transcriptional reporters provide convenient and precise spatiotemporal information on the activity of a particular signaling pathway. Cell-lineage specific reporters, on the other hand, reflect qualitative and quantitative changes in cell populations within the mosaic tissue and among tumors of distinct genotypes. Quantification of invasive behavior facilitates the comparison of tumor malignancy between genotypes. Finally, the protocol describing collection and processing of mosaic EAD for RNA isolation is suitable for both small and large-scale downstream applications such as reverse transcription followed by qRT-PCR and genome-wide mRNA-seq, respectively. The qualitative and quantitative data obtained from these assays provide novel insights into the social behavior of clonal tumors. Moreover, they produce a solid foundation for functional studies on the role of individual genes, genetic networks and tumor microenvironment in different stages and aspects of tumorigenesis.
NOTE: This work utilizes the eyFLP1; act>y+>Gal4, UAS-GFP; FRT82B, tub-Gal80 MARCM 82B Green tester line 11. Crossing the MARCM 82B Green tester virgins to males of strains such as w; UAS-a; UAS-bRNAi, FRT82B cmut genotype will yield progeny in which mitotic recombination will occur between the right arms of the 3rd homologous chromosomes. In this way, clones homozygous mutant for gene c located distal to the FRT82B site will be generated within the EAD and brain neuroepithelium. These clones will express GFP, transgene a and dsRNA for gene b (Figure 1A). Various eyFLP-MARCM tester lines for recombination on the X, 2L, 2R, 3L and 3R have been established and are available within the fly community.
1. Fly Handling, Crosses, and Staging
2. Collecting Third Instar Larvae
3. Dissection of Larvae
4. Fixing, Immunostaining, and Mounting
5. Confocal Imaging
6. Quantification of Tumor Invasiveness
7. RNA Isolation, DNase Treatment, and Quality Check
NOTE: All reagents (solutions, plasticware) used in the following steps should be free of RNase activity. Always wear gloves and use a chemical hood for work with organic solvents.
To demonstrate the potential of the eyFLP-MARCM technique to generate GFP-marked patches of defined genotypes in Drosophila EAD, three types of clones were induced: (1) control expressing GFP only, (2) malignant tumors expressing an oncogenic form of the small G-protein Ras (RasV12) in a background of homozygous loss of a tumor suppressor gene scribble (scrib1), and (3) overgrowing but non-invasive rasV12scrib1jnkDN clones, where the Jun-N-terminal kinase (JNK) was inactivated by expression of its dominant-negative form (Figure 4, Table 1 for genotypes). It has been shown that the invasiveness of rasV12scrib1 clonal tumors requires aberrant activation of JNK signaling and its downstream transcription factors 10,12,23,24. Moreover, rasV12scrib1 tumors promote a strong inflammatory response in the Drosophila larva, resulting in infiltration of immune cells (called hemocytes) into the EAD 14,25.
To monitor the levels and spatial distribution of JNK activity within the mosaic tissue and among tumors of distinct genotypes, the established transgenic, JNK-responsive TRE-DsRed reporter was employed 26. Confocal microscopy of the dissected, fixed EAD and EAD/brain complexes revealed marked upregulation of the TRE-DsRed reporter activity in the tissues bearing malignant rasV12scrib1 tumors (Figure 4B). The DsRed signal labeled rasV12scrib1 clones in EAD (Figure 4B) as well as tumor cells spreading over the brain lobes and invading the VNC (Figure 4E, 4F). In contrast, the TRE-DsRed reporter activity remained restricted to a string of cells extending from the antennal to the eye part of the control discs (Figure 4A'). Blocking JNK signaling resulted in a dramatic decrease of TRE-DsRed signal in clonal rasV12scrib1jnkDN tumors (Figure 4C, 4D). These data thus provide functional evidence for a requirement of JNK signaling to activate the TRE-dependent transcriptional response in malignant rasV12scrib1 tumors. A lineage-specific hmlΔ-DsRed reporter, devised for tracing Drosophila hemocytes 27,28 showed an accumulation of immune cells in tissues bearing malignant rasV12scrib1 tumors (Figure 5B). In contrast, only individual hemocytes or a few localized hemocyte patches were detected in control and rasV12scrib1jnkDN mosaic EAD and brain tissues (Figure 5A, 5C). Immunostaining with a pan-hemocyte anti-Hemese antibody (H2) 29 confirmed the immune cell identity of hmlΔ-DsRed positive cells (Figure 5D, 5E). Consistent with published reports 12,23,24, unbiased quantification of tumor invasiveness corroborated a central role of JNK signaling in promoting tumor invasion into the adjacent brain lobes and VNC (Figure 3C). Finally, total RNA was isolated from the mosaic EAD. Samples were subjected either to qRT-PCR or analyzed on an automated electrophoresis system for quality and quantity. Figure 6A shows significant JNK-dependent upregulation of matrix metalloproteinase 1 (mmp1) transcript in EAD bearing malignant rasV12scrib1 clonal tumors, confirming the previously published findings 12,24,30,31. Assessment of total RNA using an automated electrophoresis system showed that three independent EAD samples had a 28S/18S ratio above 1.8 (Figure 6B). However, EAD 2 RNA was partially degraded, reflected by a smear on the gel (Figure 6C). In contrast, EAD 3 sample had a low concentration. Multiple bands of higher molecular weight on gel image (Figure 6B) and small peaks on the electropherogram (Figure 6C), also suggested DNA contamination. Thus, only EAD 1 sample would be suitable for a preparation of mRNA-seq library.
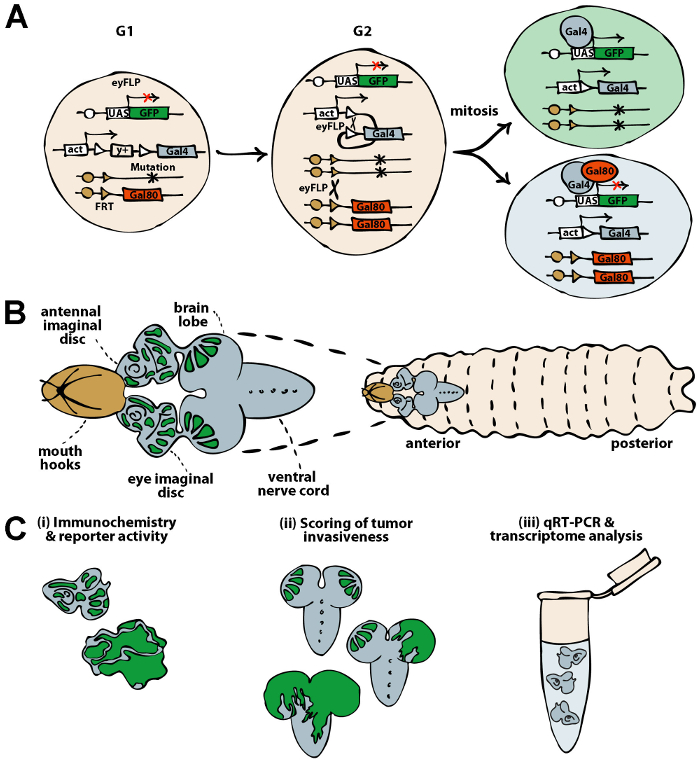
Figure 1: Schematics of the MARCM system for generation of genetic mosaics in the Drosophila EAD and downstream applications. (A) The MARCM system enables generation of clonal patches with defined genetic lesions in an otherwise wild type (heterozygous) context. The expression of FLP under the control of a tissue specific promoter (e.g., eyeless) catalyzes recombination between the two FRT elements flanking the STOP cassette marked with a yellow (y) gene (act>y+>Gal4). Upon removal of the STOP cassette, the ubiquitously expressed Gal4 transcriptional activator (act-Gal4) can drive expression of any UAS-based transgene such as UAS-GFP (also UAS-rasV12). In a parental cell, however, the Gal4 activity is blocked by a Gal80 repressor whose expression is controlled by a tubulin promoter (tub-Gal80). In the G2 phase of the cell cycle, FLP mediates the exchange of the non-sister chromatids between the homologous chromosomes distal to the FRT sites. The segregation of the recombinant chromosomes during mitosis will give rise to two daughter cells, one being homozygous mutant for a particular genomic locus (e.g., scrib1) while the other will carry two wild type alleles. Loss of Gal80 in the homozygous mutant cells will permit expression of GFP. In contrast, a wild type sister stays GFP-negative. (B) A schematic drawing of a third instar larva depicts the EAD pair connected anteriorly to the mouth hooks and posteriorly to the brain via optic stalks. The eyFLP-MARCM system induces GFP-marked clones within the EAD and the neuroepithelium of the brain lobes. (C) Dissected EAD and brains can be subjected to diverse downstream applications including immunochemistry and detection of transgenic reporter activity (i), quantification of tumor invasiveness (ii) and transcriptome profiling using a candidate (qRT-PCR) or an unbiased approach (mRNA-seq) (iii). Please click here to view a larger version of this figure.
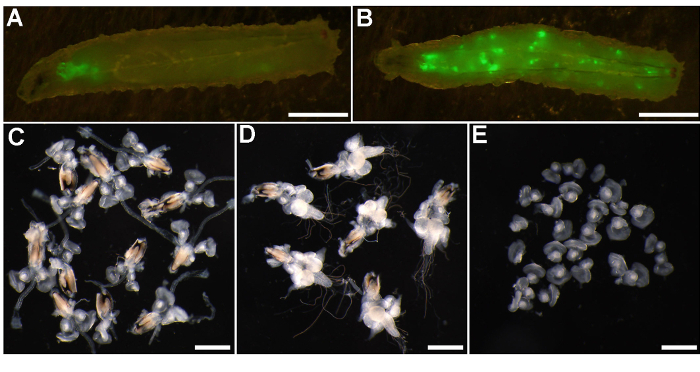
Figure 2: Sorting of third instar larvae and representative examples of EAD and EAD/brain complexes used for different downstream applications. (A-B) Fluorescent micrographs of the third instar larvae bearing control GFP-labeled clones induced with the eyFLP-MARCM 82B Green tester. (A) Representative control larva with clones restricted to the EAD and brain lobes. (B) An example of a "leopard larva" carrying GFP-positive clones in various tissues throughout the body. (C) Brightfield images of dissected EAD and (D) EAD/brain complexes attached to the mouth hooks, and (E) EAD cleaned from all extraneous tissue including mouth hooks. Scale bars = 2 mm (A-B) and 500 µm (C-E). Please click here to view a larger version of this figure.
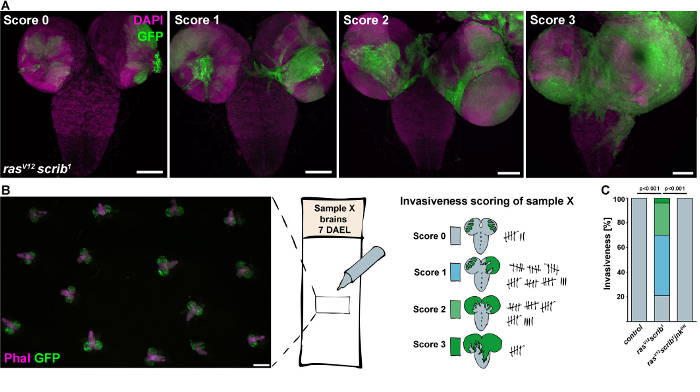
Figure 3: Quantification of tumor invasiveness. (A) Fluorescent confocal images of brains dissected from rasV12 scrib1 larvae (7 days AEL) represent the real examples of the four different grades of tumor invasiveness ranging from non-invasive (Score 0), one brain lobe invaded (Score 1), both brain lobes invaded (Score 2) to a strong tumor invasion with clonal tissue covering both brain lobes and entering the VNC (Score 3). Images are projections of multiple confocal sections and examples for Score 2 and 3 are stitched from 2 x 2 confocal images. Scale bars = 100 µm. (B) An example of an anonymized microscope slide with fixed brains used for unbiased scoring under a fluorescent stereomicroscope. Scored brains are marked with a pen to prevent duplicate registration. Scale bar = 500 µm (C) Compared to highly invasive rasV12scrib1 tumors, inhibition of JNK signaling (rasV12scrib1jnkDN) eliminated invasion of clonal cells. Please click here to view a larger version of this figure.
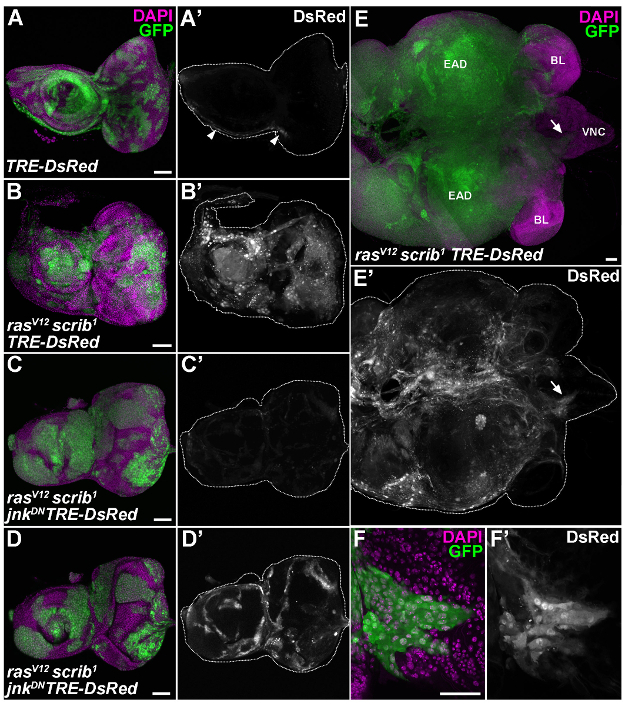
Figure 4: Activation of the transcriptional TRE-DsRed reporter in malignant ras'V12'scrib'1 clonal tumors is JNK-dependent. (A) In control EAD (6 days AEL), the JNK-sensitive TRE-DsRed reporter labeled a narrow stripe of cells running from antennal to eye part (arrowheads). (B) The activity of the TRE-DsRed reporter was markedly enhanced in rasV12scrib1 GFP-positive clones compared to the surrounding non-clonal EAD epithelium. (C) Inhibition of JNK activity resulted in a clear reduction of DsRed signal intensity in rasV12scrib1jnkDN clones. (D) Further enhancement of the DsRed signal revealed non-autonomous activation of JNK signaling in cells surrounding the rasV12scrib1jnkDN clones. (E) On day 8 AEL, rasV12scrib1 cells overgrew the entire EAD and spread over the brain lobes to the VNC (arrow). (F) The clonal cells invading the VNC (close-up of the region marked by the arrow in E) were enriched for the DsRed signal. (A-C) Show projections of multiple confocal sections, (E) is stitched from 3×3 confocal images and (D, F) represent single section. Scale bars = 50 µm. EAD, eye/antennal disc; BL, brain lobe; VNC, ventral nerve cord. Please click here to view a larger version of this figure.
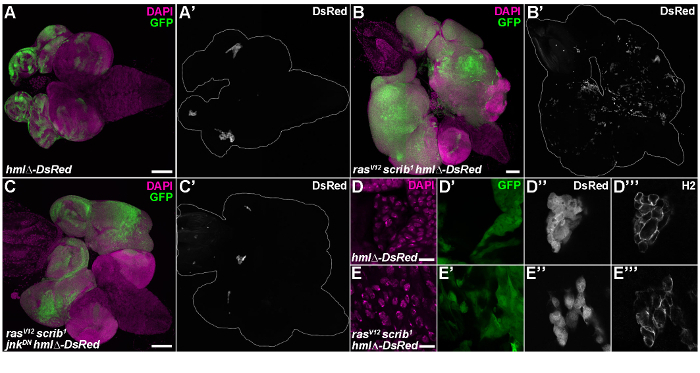
Figure 5: Lineage-specific hmlΔ-DsRed transgenic reporter reveals enrichment of rasV12scrib1 tumor-associated hemocytes. (A) In control EAD, hmlΔ-DsRed reporter-labeled hemocyte clusters are trapped in the indentations of the eye and antennal epithelium. (B) EAD and brain tissue comprised of rasV12scrib1 GFP-marked tumors showed an increased number of hemocytes scattered all over the clonal tissue. (C) The number of associated hemocytes dramatically decreased upon inhibition of JNK signaling in rasV12scrib1jnkDN mosaic tissue. (D-E) HmlΔ-DsRed positive hemocytes were also labeled with an H2-antibody that detects the pan-hemocyte marker Hemese. (A-C) Show projections of multiple confocal sections, (A) is stitched from 2 x 2 and (B-C) are stitched from 3 x 3 confocal images. (D-E) Represent single sections. Scale bars = 100 µm (A-C) and 10 µm (D-E). Please click here to view a larger version of this figure.
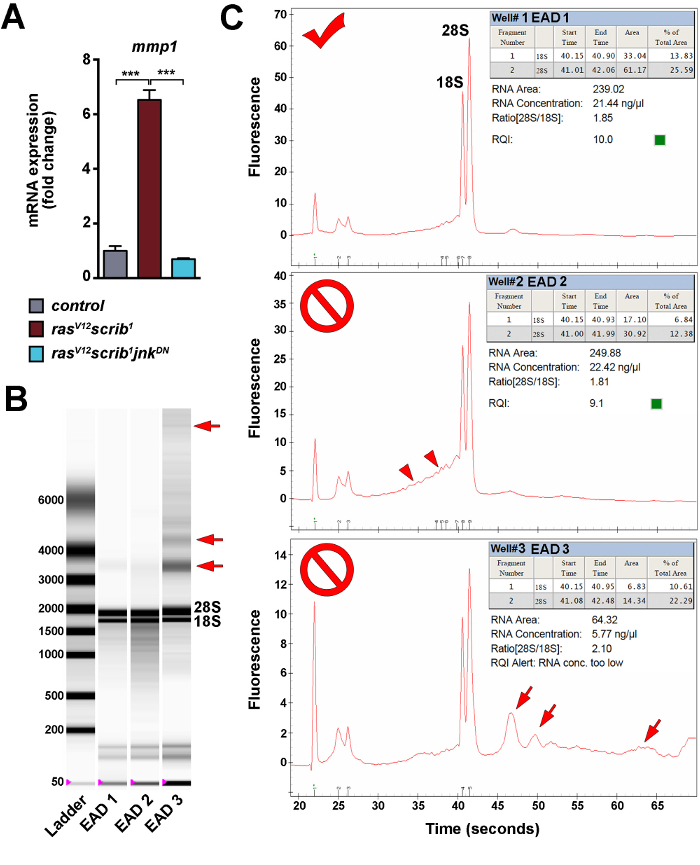
Figure 6: Evaluation of quantity and quality of total RNA isolated from dissected EAD. (A) A representative example of qRT-PCR results using four biological replicates for each genotype. Mmp1 transcript levels were normalized to rp49. Fold changes in gene expression were calculated using the relative standard curve method 32. Data are mean values ± s.e.m.; ***P <0.001 using Student's unpaired two-tailed t-test with unequal variance. (B, C) Assessment of total RNA quality and quantity using an automated electrophoresis system. The virtual gel image (B) shows the two prominent bands of the 18S and 28S rRNAs that correspond to the well-defined peaks on electropherograms (C). DNA contamination and RNA degradation are reflected by a smear (arrowheads) and extranumerary bands and peaks (arrows). Please click here to view a larger version of this figure.
Fly Strains | Source/Comments |
eyFLP1; act>y+>Gal4, UAS-GFP; FRT82B, tub-Gal80 | eyFLP-MARCM 82B Green Tester 11 |
w; UAS-rasV12; FRT82B scrib1/TM6B | 12 |
w; UAS-rasV12; UAS-jnkDN FRT82B scrib1/TM6B | 12 |
w; hmlΔ-DsRed; FRT82B | this study, w; hmlΔ-DsRed from Katja Brückner 28 |
w; UAS-rasV12 hmlΔ-DsRed; FRT82B scrib1/TM6B | this study |
w; UAS-rasV12 hmlΔ-DsRed; UAS-jnkDN FRT82B scrib1/TM6B | this study |
w; TRE-DsRed; FRT82B | this study, w; TRE-DsRed from Dirk Bohmann 26 |
w; UAS-rasV12 TRE-DsRed; FRT82B scrib1/TM6B | this study |
w; UAS-rasV12 TRE-DsRed; UAS-jnkDN FRT82B scrib1/TM6B | this study |
Table 1: Summary of Drosophila lines used in this study.
The techniques to generate genetic mosaics in Drosophila are among the most sophisticated tools for analyzing and manipulating gene function 33. The eyFLP-MARCM system has proven powerful and robust as it allows the induction of visually marked, genetically defined clones in a spatially restricted manner, i.e., in tissues where the eyeless enhancer is active 9,18. This is particularly important when multiple genetic lesions are combined in the same cells. While these highly aberrant patches permit larval development when restricted to the EAD and brain neuroepithelia, they can cause lethality when scattered throughout the larval body as in the case of heat shock-controlled FLP (hsFLP) clones. Significantly, induction of clones in the fly EAD epithelium in which activated oncogenes combine with loss of tumor suppressors recapitulates the emergence and progression of solid epithelial tumors in some human cancers. However, the system also has its limitations that will be briefly discussed. Given that insects have an open circulatory system, true metastases as observed in human cancers do not occur. Therefore the complex process of metastatic dissemination cannot be faithfully modeled in Drosophila. Nevertheless, EAD tumors such as the rasV12scrib1 clones do display malignant properties as they break down the basal membrane surrounding the EAD and invade the adjacent brain 11,12,31. The degree of tumor aggressiveness can be quantified and compared among different genotypes as described in this study. It is also important to note that the presence of specific genetic lesions in mosaic EAD might affect developmental timing and duration of larval growth. Staging of larvae will determine whether analysis of mosaic tissue will be done using animals of the same chronological or developmental stage. Performing a pilot experiment to assess the impact of a new EAD clonal genotype on developmental timing is desirable.
There are technical limitations as well. First, the number of different clonal genotypes that can be built with the eyFLP-MARCM tool is great but not infinite. For instance, combining two mutant alleles that reside on different chromosomes is hindered by low efficiency of recombination on both chromosomes simultaneously, and genes located on the small fourth chromosome are generally inaccessible. Gene knockdown using transgenic RNAi is an alternate solution. However, it is important to realize that transgenes are not expressed immediately upon mitotic recombination — not until the Gal80 repressor is degraded. The activity of the Gal4/UAS expression system can be enhanced by growing larvae at 29 °C. It is, however, important to keep in mind that elevated temperature affects various developmental, physiological and molecular parameters including growth rate, developmental timing, metabolism and gene expression 34-37. Thus, adaptations to the provided protocols such as staging of the larvae or number of dissected EAD for transcriptome profiling would be necessary.
The eyFLP-MARCM testers are not among the healthiest strains. The multiple transgenes in one genome compromise fly fitness and fecundity. These stocks require extra attention to be maintained and expanded for large collections of virgin females. As documented in this study, the MARCM 82B Green tester line 11, although viable when homozygous, is genetically unstable. This is obvious from the spontaneous appearance of "leopard larvae" that display ectopic, GFP-labeled clones within various polyploid tissues including the intestine, tracheae, fat body, and larval epidermis. This phenomenon occurs in all crosses independent of the paternal genotype. We presume that the ectopic GFP patches result from uncontrolled, stochastic recombination between the two FRT sites in the FLP-out cassette, causing removal of the yellow+ marker and the "STOP cassette". In the polyploid tissues, the tubulin promoter-driven Gal80 repressor might be insufficient to block the Gal4 activity. The presence of genetically modified cells in tissues other than the EAD and brain could elicit systemic signals that might affect behavior of the experimental clones. These "leopard larvae" should therefore be excluded from analyses. Moreover, we routinely re-establish the MARCM 82B Green tester from single male-female crosses.
Despite the pitfalls mentioned above, the applications of the eyFLP-MARCM system to study gene functions and the interactions between clonal tumors and their environment are manifold. Introduction of the Gal4/UAS-independent binary expression systems such as LexA/LexOp 38 or drug controllable QF/QUAS/QS 39,40 would provide a fine control over transgene expression and/or simultaneous labeling and manipulation of different cell populations including clonal, non-clonal epithelial cells and hemocytes. Such mosaic tissues could be again processed according to protocols described here.
The method for dissection of mosaic EAD and EAD/brain complexes from the third instar larvae (Protocol section 3) can be applied to earlier developmental stages as well. Importantly, the protocol for EAD/brain complexes permits recovery of the wing, haltere and leg imaginal discs. Should these be used for RNA isolation (Protocol sections 3.3.2 and 7), the disc of interest should be cleaned from extraneous tissue and processed similarly to EAD. Given their smaller size, the number of haltere and leg discs collected should be increased to acquire sufficient amount of RNA.
The protocol for extraction of total RNA from EAD (Protocol section 7) is based on RNA lysis reagent available from different commercial vendors (see List of Materials/Equipment). The overall success of the procedure mainly depends on: (i) having sufficient number of larvae, (ii) being quick and precise while dissecting, and (iii) keeping samples free from RNases. Keeping the work space and instruments clean, wearing gloves, using RNase-free plastic ware and solutions, and keeping samples on ice all reduce RNA degradation. To prevent contamination of RNA with any genomic DNA that might not be completely removed by the DNase treatment (Protocol section 7.11), it is critical to avoid interphase when collecting the aqueous phase for the first time (Protocol section 7.6). Both DNA contamination and RNA degradation can be revealed by running samples on an automated electrophoresis system (Figure 6B, 6C). The RNA isolation protocol has a broader application. It has been successfully used for RNA extraction from whole larvae at different developmental stages, from adults, and various larval organs. The obtained RNA was suitable for both qRT-PCR and genome-wide transcriptome analysis by mRNA-seq 20,24,41,42. Compared to qRT-PCR that quantifies tens of selected mRNAs at most, unbiased mRNA sequencing permits genome-wide expression analyses. Thus, one can compare entire transcriptome signatures of tumors induced by specific genetic lesions at distinct stages of tumorigenesis 24. It is important to keep in mind that RNA comes from the entire discs, so that results will not only reflect changes in the clones but also in the surrounding, non-clonal tissue. Performing fluorescent activate cell sorting (FACS) on dissociated mosaic EAD by adapting available protocols 43,44 could be applied to determine transcriptional signature of specific cellular populations, e.g., clonal (GFP+) and non-clonal (GFP–) cells.
The fixation and immunostaining protocol described here is suited for simultaneous visualization of proteins of interest with specific antibodies and activity of transgenic reporters. Both the GFP signal marking clonal cells and DsRed fluorescence produced by either of the two transgenic reporters used in this study are preserved throughout fixation and immunostaining and can be directly visualized by confocal microscopy. However, antibodies against the fluorescent proteins can amplify the signal intensity. Similarly, use of an anti-β-galactosidase antibody will facilitate detection of transgenic reporters based on the bacterial lacZ gene. Relative reporter activities can be assessed by measuring the relative pixel intensities of clones versus non-clonal tissue using image analysis software (e.g., FiJi, ImageJ). When comparing reporter activity among different clonal genotypes, the image acquisition settings must be kept constant (Protocol section 5 and references 21,22). Although the protocol works well with many different antibodies, it may be necessary to optimize recommended antibody concentrations. Alterations might also be required in fixation time, type and concentration of detergent (Triton X-100, Tween-20, Saponin) and fixative (8% PFA, 4% formaldehyde, EtOH).
Unlike the protocols discussed above, quantification of tumor invasiveness is limited to the third instar larval stage and the EAD/brain complex. Nevertheless, its overall rationale can apply to any quantitative studies where cognitive bias needs to be avoided. The method requires thoroughness. As tumor malignancy increases in time, it is essential to compare larvae of the same age (e.g., 7 or 8 days after egg laying). With time a clonal tumor can overgrow massively, yet the tumor cells may remain within the EAD. The step in which brains are separated from the EAD (Protocol section 4.4.1) is therefore critical to avoid false-positive invasiveness counts. Mounting of brains with the attached EAD will flatten the tissues, causing the overgrown EAD to cover the brain structures and thus prevent any quantification. Ideally, one would like to capture the invasive process directly in the living larva. Transgenic reporters to visualize the involved cell populations and tissues are available and could be combined with the eyFLP-MARCM system. Unfortunately, the invasive process takes several hours to days, a time frame that is incompatible with keeping the larvae alive while still.
The authors have nothing to disclose.
We thank the Bloomington Stock Center (Bloomington, USA), Dirk Bohmann, Katja Brückner and Istvan Ando for fly stocks, and antibodies. We thank Marek Jindra and Colin Donohoe for comments on the manuscript. This work was supported by the Sofja Kovalevskaja Award to M.U. from the Alexander von Humboldt Foundation and DFG project UH243/1-1 to M.U. from the German Research Foundation.
Agar | Gewürzmühle Brecht, Eggenstein, Germany | 00262-0500 | Fly food recipe: Prepare 20 L fly food with 160 g agar, 360 g yeast, 200 g soy flour, 1.6 kg yellow cornmeal, 1.2 L malt extract, 300 ml light corn syrup, 130 ml propionic acid and 200 ml 15% nipagin. Fly food should be cooked for 1 hour at 85°C. |
Corn syrup | Grafschafter Krautfabrik Josef Schmitz KG, Meckenheim, Germany | 01939 | |
Propionic acid | Carl Roth GmbH, Karlsruhe, Germany | 6026.1 | |
Cornmeal | ReformKontor GmbH, Zarrentin, Germany | 4010155063948 | |
Malt extract | CSM Deutschland GmbH, Bremen, Germany | 728985 | |
Soy flour | Stockmeier Food GmbH, Herford, Germany | 1000246441010 | |
Yeast | Werner Ramspeck GmbH, Schwabach, Germany | 210099K | |
Methyl-4-benzoate/ Nipagin | Sigma-Aldrich, Deisenhofen, Germany | H5501 | Prepare a 15% stock solution with 70% EtOH |
Drosophila fly food vials | Kisker Biotech, Steinfurt, Germany | 789008 | |
Vial plugs | K-TK e.K., Retzstadt, Germany | 1002 | |
Drosophila fly food bottles | Greiner Bio-One, Frickenhausen, Germany | 960177 | |
Bottle plugs | K-TK e.K., Retzstadt, Germany | 1002 S | |
Poly(vinyl alcohol) 4-88/[-CH2CHOH-]n | Sigma-Aldrich, Deisenhofen, Germany | 81381 | Mounting medium recipe: Dissolve 6 g Poly(vinyl alcohol) 4-88 in 39 ml Millipore H2O, 6 ml 1 M Tris (pH 8.5) and 12.5 ml glycerol. Stir overnight at 50°C and centrifuge 20 min at 5000 rpm. Add DABCO to the supernatant to get a final concentration of 2.5%. Store aliquots at -20°C. |
1,4-Diazabicyclo[2.2.2]octane/ DABCO | Sigma-Aldrich, Deisenhofen, Germany | D2522 | |
Triton X-100 | Sigma-Aldrich, Deisenhofen, Germany | 9002-93-1 | |
Phosphate-buffered saline/ PBS | 137 mM NaCl, 2.7 mM KCl, 10 mM Na2HPO4 and 1.8 mM KH2PO4, pH 7.4 in Millipore H2O | ||
PBST | 0.1% Triton X-100 in PBS | ||
Paraformaldehyde/ PFA | Sigma-Aldrich, Deisenhofen, Germany | 158127 | 4% PFA fixative recipe: Dissolve 4 g PFA in 80 ml Millipore H2O on a magnetic stirrer plate heated to 55 °C. Add 1M NaOH dropwise until all PFA particles are dissolved. Add 10 ml 10X PBS and adjust the pH to 7.4 with 1M HCl. Mix in 100 µl Triton X-100 and fill up with Millipore H2O to 100 ml. Store aliquots at -20°C. Avoid repeated thawing. (CAUTION: PFA is highly toxic. Prepare the PFA fixative in a fume hood. Wear a self-contained breathing apparatus, gloves and clothing. Avoid contact with skin, eyes or mucous membranes) |
Bovine Serum Albumin/ BSA | Sigma-Aldrich, Deisenhofen, Germany | A3059 | Blocking solution recipe: Dissolve 0.3% BSA in PBST |
4’,6-Diamidino-2-phenylindol Dihydrochlorid/ DAPI | Carl Roth GmbH, Karlsruhe, Germany | 6335 | DAPI staining solution: Prepare a stock solution of 5 mg/ml in Millipore H2O and store aliquots at 4°C. Used in dilution 1:1000 in PBST. |
Alexa Flour 546 Phalloidin | Invitrogen, Karlsruhe, Germany | A22283 | Used in dilution 1:500 in PBST. |
Mouse anti-H2 antibody | Kurucz et al., 2003 | Used in dilution 1:500 in blocking solution | |
Cy5 AffiniPure Donkey Anti-Mouse IgG (H+L) | Jackson ImmunoResearch, Suffolk, UK | 715-175-151 | Used in dilution 1:500 in blocking solution |
Dumont #5 forceps | Fine Science Tools, Heidelberg, Germany | 11295-10 | |
Glass embryo dish (30 mm) | Thermo Scientific, Schwerte, Germany | E90 | |
Tungsten needles | Fine Science Tools, Heidelberg, Germany | 10130-20 | |
Nickel Plated Pin Holder | Fine Science Tools, Heidelberg, Germany | 26018-17 | |
Microscope slides | VWR, Darmstadt, Germany | 631-1553 | |
Coverslips 22 x 22 mm (#1 Menzel-Gläser) | VWR, Darmstadt, Germany | 631-1336 | |
Coverslips 24 x 50 mm (0.13-0.16 mm) | Thermo Scientific, Schwerte, Germany | 1076371 | |
Kimtech Science Precision Wipes | Thermo Scientific, Schwerte, Germany | 06-677-70 | |
Dissecting stereomicroscope | Olympus, Hamburg, Germany | SZX7 (DF PLAPO 1X-4 Japan) | |
Fluorescent stereomicroscope | Olympus, Hamburg, Germany | SZX16 (SDF PLAPO 0.8X Japan) with DP72 CCD camera | Equipped with the narrow blue bandpass filter set for excitation of GFP other blue excitable fluorochromes (excitation filter BP460-480 nm, barrier filter BA495-540 nm) and narrow green excitation and longpass barrier filter for RFP and other green excitable fluorochromes (excitation filter BP530-550, barrier filter BA575IF). Software: Olympus cellSens Standard 1.11. |
Confocal microscope | Olympus, Hamburg, Germany | FV1000 | Equipped with inverted IX81 microscope. Objectives: 20× UPlan S-Apo (NA 0.85), 40× UPlanFL (NA 1.30) and 60× UPlanApo (NA 1.35). Lasers: UV laser Diode LD405 (50mW), Argon laser, multi-line 457/(476)/ 488/515 (40mW), Yellow/Green laser diode LD560 (15mW) and Red Laser diode 635 (20mW). Software: Fluoview 2.1c Software |
Drosophila cooled incubator | Ewald Innovationstechnik GmbH, Bad Nenndorf, Germany | Sanyo MIR553 | |
Squirt bottle | VWR, Darmstadt, Germany | 215-8105 | |
BD Clay Adams Nutator Mixer | VWR, Darmstadt, Germany | 15172-203 | |
ELMI Digital Rocking Shaker | VWR, Darmstadt, Germany | DRS-12 | |
5 PRIME Isol-RNA Lysis Reagent | VWR, Darmstadt, Germany | 2302700 | The protocol is compatible with other TRIzol-based reagents e.g. TRIreagent from Sigma (Cat. Nr.T9424), TRIzol reagent from Thermofisher (Cat. Nr. 15596). |
Diethyl pyrocarbonate/ DEPC | Sigma-Aldrich, Deisenhofen, Germany | D5758 | Dilute DEPC 1:1000 in Millipore H2O, stir overnight and autoclave. |
UltraPure Phenol:Chloroform:Isoamyl Alcohol (25:24:1) | ThermoFischer Scientific, Invitrogen, Karlsruhe, Germany | 15593-031 | |
Chloroform | Merck, Darmstadt, Germany | 102445 | |
TURBO DNase (2 U/µl) | Thermo Scientific, Schwerte, Germany | AM2238 | |
Invitrogen UltraPure Glycogen | ThermoFischer Scientific, Invitrogen, Karlsruhe, Germany | 10-814-010 | |
Sodium acetate trihydrate | VWR, Darmstadt, Germany | 27652.232 | Prepare a 3M Sodium acetate solution with DEPC-H2O and adjust the pH to 5.2 |
2-Propanol | Merck, Darmstadt, Germany | 109634 | |
Ethanol | Merck, Darmstadt, Germany | 100983 | Prepare a 75% EtOH dilution with DEPC-H2O. |
UV/Vis-Spectrophotometre NanoDrop ND-8000 | Thermo Scientific, Schwerte, Germany | ND-8000 | |
Eppendorf Microcentrifuge (Refrigerated) | Thermo Scientific, Schwerte, Germany | 5417R | |
Experion RNA StdSens Analysis Kit | Bio-Rad Laboratories GmbH, München, Germany | 7007103 | |
Experion Automated Electrophoresis Station | Bio-Rad Laboratories GmbH, München, Germany | 7007010 | |
SuperScript III Reverse Transcriptase | Thermo Scientific, Schwerte, Germany | 18080044 | |
Oligo d(T) Primer | Integrated DNA Technologies, Leuven, Belgium | Prepare 100 µM stock solutions in DEPC-H20 and store at -20°C | |
dNTP Mixture | Takara Bio Europe/Clonetech, Saint-Germain-en-Laye, France | 4030 | Store aliquots of 25 µl at -20°C |
CFX96 Touch Real-Time PCR Detection System | Bio-Rad Laboratories GmbH, München, Germany | 1855195 | |
iQ SYBR Green Supermix | Bio-Rad Laboratories GmbH, München, Germany | 170-8882 | |
Hard-Shell PCR Plates 96-well, thin wall | Bio-Rad Laboratories GmbH, München, Germany | HSP9601 | |
Microseal 'B' Film | Bio-Rad Laboratories GmbH, München, Germany | MSB1001 | |
rp49 Forward primer | Integrated DNA Technologies, Leuven, Belgium | 5' TCCTACCAGCTTCAAGATGAC 3' | |
rp49 Reverse primer | Integrated DNA Technologies, Leuven, Belgium | 5' CACGTTGTGCACCAGGAACT 3' | |
mmp1 Forward primer | Integrated DNA Technologies, Leuven, Belgium | 5' AGGGCGACAAGTACTACAAGCTGA 3' | |
mmp1 Reverse primer | Integrated DNA Technologies, Leuven, Belgium | 5' ACGTCTTGCCGTTCTTGTAGGTGA 3' |