This protocol introduces dual-dye optical mapping of mouse hearts obtained from wild-type and knock-in animals affected by catecholaminergic polymorphic ventricular tachycardia, including electrophysiological measurements of transmembrane voltage and intracellular Ca2+ transients with high temporal and spatial resolution.
The pro-arrhythmic cardiac disorder catecholaminergic polymorphic ventricular tachycardia (CPVT) manifests as polymorphic ventricular tachycardia episodes following physical activity, stress, or catecholamine challenge, which can deteriorate into potentially fatal ventricular fibrillation. The mouse heart is a widespread species for modeling inherited cardiac arrhythmic diseases, including CPVT. Simultaneous optical mapping of transmembrane potential (Vm) and calcium transients (CaT) from Langendorff-perfused mouse hearts has the potential to elucidate mechanisms underlying arrhythmogenesis. Compared with the cellular level investigation, the optical mapping technique can test some electrophysiological parameters, such as the determination of activation, conduction velocity, action potential duration, and CaT duration. This paper presents the instrumentation setup and experimental procedure for high-throughput optical mapping of CaT and Vm in murine wild-type and heterozygous RyR2-R2474S/+ hearts, combined with programmed electrical pacing before and during the isoproterenol challenge. This approach has demonstrated a feasible and reliable method for mechanistically studying CPVT disease in an ex vivo mouse heart preparation.
Inherited cardiac disorder catecholaminergic polymorphic ventricular tachycardia (CPVT) manifests as polymorphic ventricular tachycardia (PVT) episodes following physical activity, stress, or catecholamine challenge, which can deteriorate into potentially fatal ventricular fibrillation1,2,3,4. Recent evidence following its first report as a clinical syndrome in 1995 implicated mutations in seven genes, all involved in sarcoplasmic reticular (SR) store Ca2+ release in this condition: the most frequently reported RYR2 encoding ryanodine receptor 2 (RyR2) of Ca2+ release channels5,6, FKBP12.67, CASQ2 encoding cardiac calsequestrin8, TRDN encoding the junctional SR protein triadin9, and CALM19, CALM210, and CALM3 identically encoding calmodulin11,12. These genotypic patterns attribute the arrhythmic events to the unregulated pathological release of SR store Ca2+12.
Spontaneous Ca2+ release from SR can be detected as Ca2+ sparks or Ca2+ waves, which activates the Na+/Ca2+ exchanger (NCX). The exchanger of one Ca2+ for three Na+ generates an inward current, which speeds up the diastolic depolarization and drives the membrane voltage to the threshold of action potential (AP). In RyR2 knock-in mice, the increased activity of RyR2R4496C in the sinoatrial node (SAN) leads to an unanticipated decrease in SAN automaticity by Ca2+-dependent decrease of ICa,L and SR Ca2+ depletion during diastole, identifying subcellular pathophysiologic alterations contributing to the SAN dysfunction in CPVT patients13,14. Occurrence of the related cardiomyocyte cytosolic Ca2+ waves is more likely following increases in background cytosolic [Ca2+] following RyR sensitization by catecholamine, including isoproterenol (ISO), challenge.
Detailed kinetic changes in Ca2+ signaling following RyR2-mediated Ca2+ release in response to action potential (AP) activation that may be the cause of the observed ventricular arrhythmias in intact cardiac CPVT models remain to be determined for the full range of reported RyR2 genotypes12. This paper presents the instrumentation setup and experimental procedure for high-throughput mapping of Ca2+ signals and transmembrane potentials (Vm) in murine wild-type (WT) and heterozygous RyR2-R2474S/+ hearts, combined with programmed electrical pacing before and after isoproterenol challenge. This protocol provides a method for the mechanistic study of CPVT disease in isolated mouse hearts.
Male 10 to 14-week-old wild-type mice or RyR2-R2474S/+ mice (C57BL/6 background) weighing 20-25 g are used for the experiments. All procedures have been approved by the animal care and use committee of Southwest Medical University, Sichuan, China (approval NO:20160930) in conformity with the national guidelines under which the institution operates.
1. Preparation
2. Procedures
Optical mapping has been a popular approach in studying complex cardiac arrhythmias in the past decade. The optical mapping setup consists of an EMCCD camera, giving a sampling rate of up to 1,000 Hz and a spatial resolution of 74 x 74 µm for each pixel. It enables a rather high signal-noise ratio during signal sampling (Figure 1). Once the Langendorff-perfused heart reaches a stable state and the dye loading finishes, the heart is placed in the homoeothermic chamber under the illumination of two 530 nm LEDs, which are used for excitation of the voltage indicator RH237 and Ca2+ indicator Rhod-2 AM. The emission light is split into two wavelengths of 600 nm (for Ca2+) and 670 nm (for Vm), which are detected simultaneously using the EMCCD camera. After perfusion of avertin and heparin for 15 mins, use the surgical instruments (Figure 2A) to open the chest and quickly extract the heart, then transfer it to the cold Krebs solution (4 °C, 95% O2, 5% CO2) (Figure 2B). Clean out the surrounding tissues carefully, fix the aorta with a 4-0 suture, and a 0.7 mm plastic tube is inserted into the left ventricle (Figure 2C) to release the congestion of the perfusate in the left ventricular chamber. Put the ECG leads into the perfusate (Figure 2D) and ensure that the heart beats rhythmically according to ECG monitoring driven by the ECG recording software. Then, perform dual-dye loading in the dark (Figure 2E).
After contraction artifacts have been minimized by blebbistatin (10 µM) and an adequate dye loading has been completed, the filming started for about 10 sinus beats before the S1S1 pacing protocol to evaluate frequency-depend electrophysiological parameter restitution properties and calcium alternans after isoproterenol (1 µM ISO) challenge (Figure 3A). Figure 3B exhibits a representative ECG wavefront of VT and corresponding action potential (AP) and CaT traces induced by a 50 Hz burst pacing sequence in a CPVT mouse. Optical signal imaging software is used to complete a semi-automatical analysis of massive video data.
Figure 4A,B show typical traces and heat maps of APD80 and CaTD80, respectively. ISO shortens APD80 in WT and CPVT mice, but no difference was found between WT and CPVT mice before and after the ISO challenge (Figure 4C, **P < 0.01. n = 5/6). Figure 4D indicates that CaTD80 in CPVT mice are longer than in WT after the ISO challenge, while there was no significance before ISO treatment (**P < 0.01. n =6.).
For conduction measurement, Figure 5A presents a single vector algorithm for the quantification of CV. According to the voltage signals, the WT and CPVT hearts possess the same conduction ability across the epicardium at baseline and after ISO intervention (Figure 5B). Figure 5C,D show the representative activation maps of voltage and calcium in WT and CPVT hearts before and after the ISO challenge.
Calcium alternans is a critical parameter for arrhythmia. Calcium amplitude alternans is calculated according to the formulation as shown in Figure 6A. Calcium signals in WT hearts stay stable at baseline during consecutive S1S1 pacing at 14.29 and 16.67 Hz (Figure 6B), while CPVT hearts show frequency-dependent alternans (Figure 6C). After the ISO challenge, CPVT hearts exhibit frequency-dependent alternans in calcium signal during S1S1 pacing, while WT hearts are not influenced (Figure 6D,E). After continuous S1S1 pacing, a burst pacing protocol is performed to induce lethal arrhythmias. WT and CPVT hearts exhibit normal conduction during 50 Hz burst pacing at baseline (Figure 7A). After perfusion with ISO, CPVT hearts show high-frequency rotors after 50 Hz burst pacing, while WT hearts maintain normal conduction (Figure 7B).
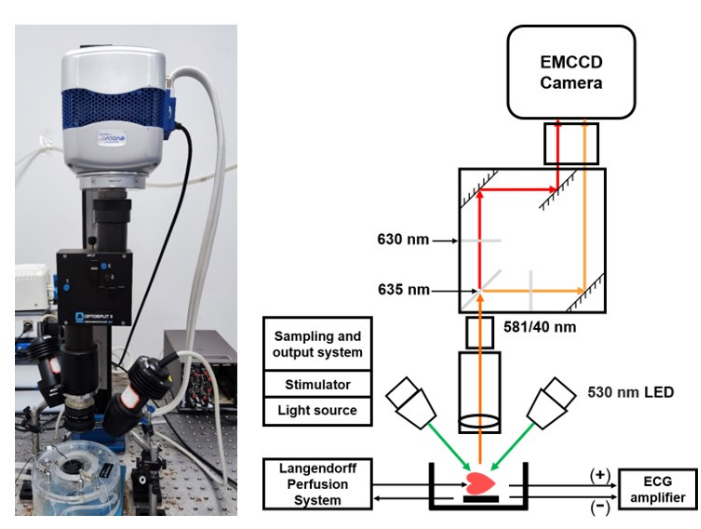
Figure 1: Optical mapping apparatus. The system includes a custom-designed EMCCD camera with a high spatial-temporal resolution (sampling rate up to 1,000 Hz, minimal sampling pixel 74 x 74 µm). An electric stimulation controller is used for sampling and output electric stimulation protocol. Two green LEDs are used for the excitation light of fluorescence probes. A long-pass dichroic mirror (610 nm) and corresponding emitters split the voltage and calcium fluorescence emission lights. RH237, the voltage-sensitive dye, has an emission light at a peak wavelength of 670 nm, while Rhod-2 AM, the calcium-sensitive dye, possesses an emission light at a peak wavelength of 600 nm. Minor changes in both fluorescence signals could be captured by the camera simultaneously because of the camera sensor's high sampling rate and sensitivity. Abbreviations: EMCCD = electron-multiplying charge-coupled device; LED = light-emittting diode; ECG = electrocardiogram. Please click here to view a larger version of this figure.
Figure 2: Preparation and dual-dye loading. (A) The surgical instruments. (B) Harvest of the mouse heart.(C) Cut off the unnecessary tissue carefully for a clear view of the aorta and insert a 0.7 mm plastic tube from the aorta into the left ventricle. (D) The heart is removed quickly to the Langendorff perfusion system. (E) Dual-dye loading and excitation-contraction cessation in the dark. Please click here to view a larger version of this figure.
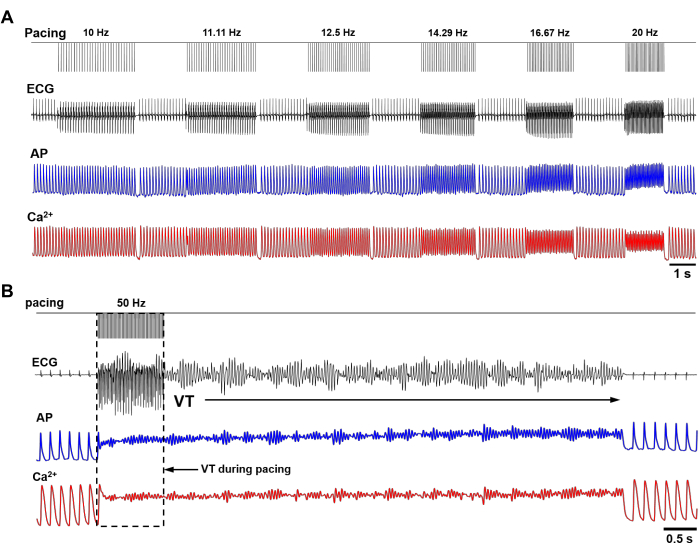
Figure 3: S1S1 protocol and arrhythmia induction protocol. (A) Representative ECG wavefront and corresponding AP and calcium signal traces using S1S1 pacing protocol after ISO challenge. (B) VT induction by a 50 Hz burst pacing sequence after perfusion of ISO in a CPVT mouse. Abbreviations: ECG = electrocardiogram; AP = action potential; ISO = isoproterenol; VT = ventricular tachycardia; CPVT = catecholaminergic polymorphic ventricular tachycardia. Please click here to view a larger version of this figure.
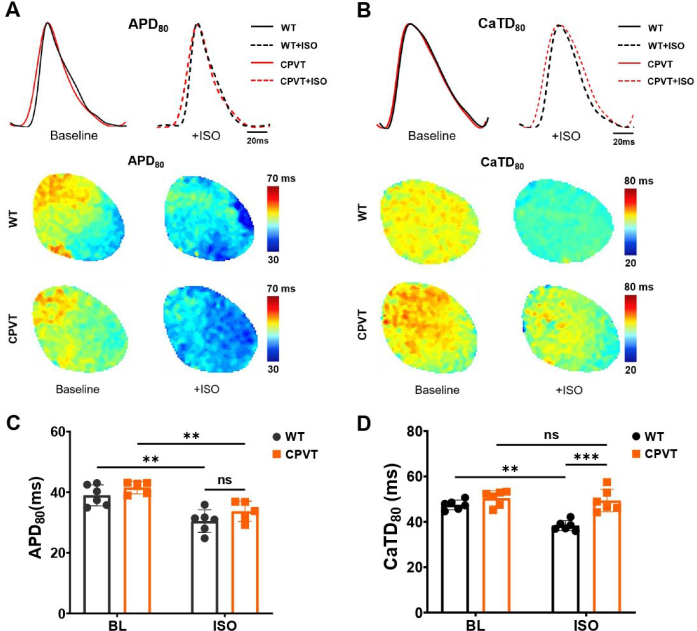
Figure 4: APD80 and CaTD80 analysis at 10 Hz before and after ISO challenge. (A) Representative AP traces and APD80 heat maps of WT and CPVT hearts before and after ISO treatment. (B) Typical CaT traces and CaTD80 heat maps of WT and CPVT hearts before and after the ISO challenge. (C) ISO shortens APD80 in WT and CPVT mice, but no difference is found between WT and CPVT mice before and after the ISO challenge. (D) CaTD80 in CPVT mice are longer than in WT after ISO challenge, while there was no significance before ISO treatment. (* P < 0.05, **P < 0.01. n =5/6.) Abbreviations: AP = action potential; APD80 = peak at 80% repolarization; ISO = isoproterenol; CPVT = catecholaminergic polymorphic ventricular tachycardia; WT = wild type. Please click here to view a larger version of this figure.
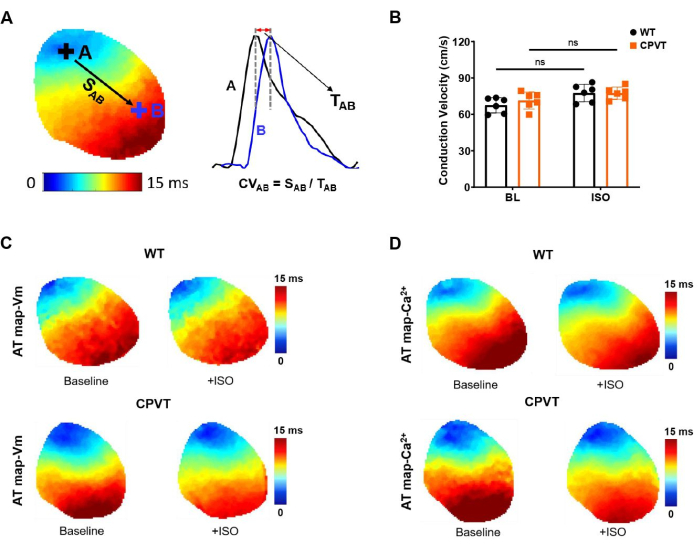
Figure 5: Conduction velocity analysis at 10 Hz. (A) The single vector algorithm of conduction velocity. (B) No difference in the CV of AP in WT and CPVT mice. (C) Representative heat maps demonstrate that CPVT mice have the same conduction ability as WT mice before and after the ISO challenge according to voltage signals. (D) No significant difference is found in the two groups for action potential-induced CaT80 isochrones before and after the ISO challenge. Abbreviations: AP = action potential; ISO = isoproterenol; CPVT = catecholaminergic polymorphic ventricular tachycardia; WT = wild type; AT = activation time; CV = conduction velocity. Please click here to view a larger version of this figure.
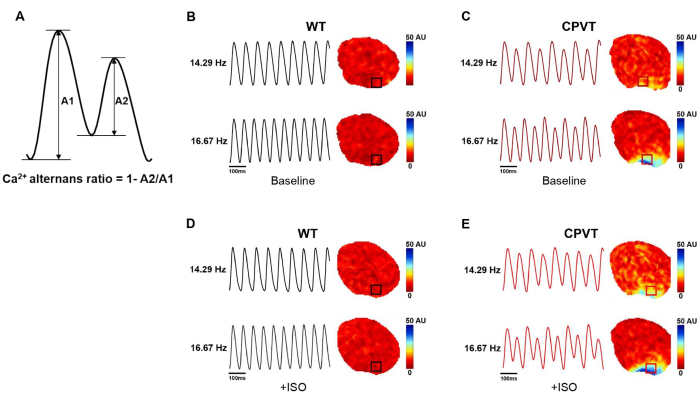
Figure 6: Calcium amplitude alternans analysis. (A) The algorithm of calculating calcium amplitude alternans. (B) Calcium signals in WT hearts stay stable at baseline during consecutive S1S1 pacing at 14.29 and 16.67 Hz, while (C) CPVT hearts show frequency-dependent alternans. (D) WT hearts are not influenced by the ISO challenge, while (E) after the ISO challenge, CPVT hearts exhibit frequency-dependent alternans in calcium signal during S1S1 pacing. Abbreviations: ISO = isoproterenol; CPVT = catecholaminergic polymorphic ventricular tachycardia; WT = wild type. Please click here to view a larger version of this figure.
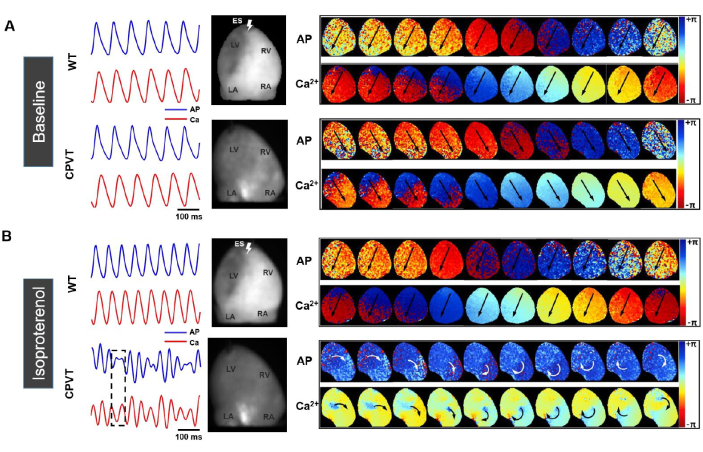
Figure 7: Tachyarrhythmia analysis using phase maps. (A) WT and CPVT hearts exhibit normal conduction during 50 Hz burst pacing at baseline. (B) After perfusion with ISO, CPVT hearts show high-frequency rotors after 50 Hz burst pacing, while WT hearts maintain normal conduction. Abbreviations: ISO = isoproterenol; CPVT = catecholaminergic polymorphic ventricular tachycardia; WT = wild type. Please click here to view a larger version of this figure.
Based on our experience, the keys to a successful dual-dye optical mapping of a mouse heart include a well-prepared solution and heart, dye loading, achieving the best signal-to-noise ratio, and reducing the motion artifact.
Preparation of solution
Krebs solution is essential for a successful heart experiment. MgCl2 and CaCl2 stock solutions (1 mol/L) are prepared in advance considering their water absorption and added to the Krebs solution after all other components are dissolved in pure water because Mg2+ and Ca2+ can easily precipitate with CO32+. The Krebs solution is bubbled with 95% O2/5% CO2 for at least 30 mins to ensure oxygenation. Because the mouse heart is particularly sensitive to pH, the solution pH should be around 7.4 after oxygenation. Even if tiny particles are in the solution, the experimental results may be affected because these particles may block the capillaries and affect the perfusion effect. Hence, the solution is filtered using a 0.22 µm aseptic needle filter before use.
Heart preparation
Before hearts are harvested, the mice are first heparinized to avoid clot formation in the coronary artery system, preventing poor dye perfusion caused by cardiac congestion from affecting the subsequent imaging. The shorter the heart's ischemic time, the better the heart's condition. Therefore, the ischemic time is controlled within 2-3 mins from hearts being harvested to cannulation via the aorta on the Langendorff system. In addition, well-maintained perfusion pressure is also essential. Hence, a thin silicone (plastic) tube is inserted into the left ventricular cavity to avoid the left ventricular pressure being too high during ventricular contraction after the left ventricular outlet is ligated, which could result in poor myocardial perfusion and anoxic tissue acidification.
Dye loading
These experiments perform dye loading by perfusing the heart in the Langendorff system. It is crucial to monitor the heart rhythm because poor dye loading will occur when the abnormal rhythm is caused by surgical operations or ischemia-reperfusion damage. The heart must be healthy enough to perform the subsequent steps. Rhod-2 AM, a Ca2+-sensitive dye, is an acetyl methyl ester derivative of Rhod 2, which is easily loaded into cells in its AM form. A 100-fold increase in the molecule's fluorescence intensity results from Ca2+ chelation17. Pluronic F127 is incorporated into the Rhod-2 AM loading solution to prevent Rhod-2 AM from polymerizing in the buffer and help it enter cells. Pluronic F127 can reduce the stability of Rhod-2 AM, so it is only recommended to add it when preparing the working solution but not in the storage solution for long-term storage. The voltage-sensitive dye RH237 is used in this study due to its favorable spectral properties for use with Ca2+ indicator Rhod-2 AM.
Achieving the best signal-to-noise ratio
Obtaining images with high signal-to-noise ratios is the target of imaging, but noise is like a shadowy ghost that always causes trouble. Due to weak signals, lower noise is particularly important in some high-speed microscopic imaging applications, such as optical mapping. The signal-to-noise ratio (SNR) is calculated as the root mean square amplitude ratio to the root mean square noise, where the noise amplitude is evaluated at resting potential18. Some factors, such as light source, optical filters, focusing optics, and photodetectors, are essential to achieve the best SNR. In the study, the background region of the sample is examined for noise, which often fluctuates at a tiny level. The optical signal detected by each pixel is the average of emitted light from its surface area. AP and calcium activities oscillate during arrhythmia, and both signals' amplitude is relatively low. Even minor interference may lead to distortion of optical signals and result in mistakes in data analysis. Therefore, the interpretation of optical signals should be careful when the local heterogeneity is caused by electrical function during arrhythmias like VT.
Reduce the motion artifact
Compared with electrode recording, optical signals are often influenced by contraction activity of the Langendorff perfused hearts because of motion artifact. To capture accurate optical signals, pharmacological inhibitors of excitation-contraction are mostly used. To minimize the motion artifact during imaging, blebbistatin is adopted to stop the heart from beating. It is a selective inhibitor of the ATPase activity of non-muscle myosin II and effectively uncouples the excitation-contraction process of the heart19,20,21. Although some studies imply some side effects using the compound22, we utilize the lowest working concentration at 10 µM to minimize the possible damage to the heart.
ElectroMap software for analysis of cardiac optical mapping datasets
ElectroMap is a high-throughput open-source software for the analysis of cardiac optical mapping datasets. It provides an analysis of main cardiac electrophysiology parameters, including AP and CaT morphology, CV, diastolic interval, dominant frequency, time-to-peak, and relaxation constant (τ) 15,23. The software allows multiple filtering options, including the Gaussian filter, Savitzky-Goaly filter, and Top-hat baseline correction. Gaussian filter is a two-dimensional smoothing by calculating the weighted average smoothing of each channel and adjacent channels. It is commonly used for spike glitch noise. Savitzky-Goaly filter fits a lower polynomial and continuous subset of adjacent datasets through the least square method, which meets the need for various smooth filtering and is also effective for processing non-periodic and non-linear datasets derived from noise. Top-hat baseline correction can adjust the optical signals to the same height according to the peaks of the traces, calculating parameters such as action potential duration (APD) and calcium transient duration (CaTD) much more accurately. Baseline drift occasionally occurs when sampling voltage and calcium fluorescence signals. It is also useful when calculating calcium alternans and amplitude. Both ventricles were selected for electrophysiological investigation.
Advantages and disadvantages of dual-dye mapping and methods to limit interference
In recent years, it has been realized that it is vital to clarify cell depolarization or repolarization and intercellular conduction heterogeneity in the whole heart, as well as coupling of the membrane clock and calcium clock, which is critical for understanding the mechanism of diseases such as arrhythmia24,25. Optical mapping has a high spatiotemporal resolution to determine the ventricular activation and repolarization properties of the heart of transgenic mice26,27,28,29. It can also detect multi-parameter imaging, for example, measurement of membrane potential and intracellular calcium of the same heart24,30 or tissue31,32 loaded with voltage and calcium-sensitive dye. Dual-dye imaging is beneficial for studying the relationship between action potential and calcium, such as the relationship between the membrane (M) clock and Ca2+ (C)-clock or spontaneous calcium release and delayed after depolarization (DAD). Normal cardiac excitation then requires the cyclic events in the two clocks to be aligned. Disruption in this alignment leads to arrhythmia25. The relationship between spontaneous calcium release and DAD is the mechanism of triggering activities in heart failure 33. However, the combination of dyes should be carefully selected. The combination of RH-237/Rhod-2 or di-4-ANEPPS/Indo-1 allows simultaneous recording, while Fluo-3/4/di-4-ANEPPS will lead to errors due to overlapping emission spectra of two dyes30,34,35. This experiment selected RH237 and Rhod-2 AM to load the heart and acquired good imaging quality.
In addition, the camera used in this protocol has two target surfaces, which enables it to capture the split signals on one sampling interface and allows a single camera to detect two different emission wavelengths. Such simultaneous mapping of optical AP and CaT combining various photoelectron spectroscopy (PES) protocols will allow us to determine the interrelationship between abnormal [Ca2+]i and electrical instability under stress conditions and the effect of post-activation potentiation on these anomalies. The spatially heterogeneous nature of SR Ca2+ cycling and how this affects the emergence, severity, and concordance of electrical alternans and arrhythmogenic behavior, such as spatially discordant alternans and consequent VTs, will be studied in the intact heart in different groups. SR Ca2+ alternans, RyR2 refractoriness and their role in SR Ca2+ and APD alternans will be explored.
The authors have nothing to disclose.
This study is supported by the National Natural Science Foundation of China (81700308 to XO and 31871181 to ML, and 82270334 to XT), Sichuan Province Science and Technology Support Program (CN) (2021YJ0206 to XO, 23ZYZYTS0433, and 2022YFS0607 to XT, and 2022NSFSC1602 to TC) and State Key Laboratory for Chemistry and Molecular Engineering of Medicinal Resources (Guangxi Normal University) (CMEMR2017-B08 to XO), MRC (G10031871181 to ML02647, G1002082, ML), BHF (PG/14/80/31106, PG/16/67/32340, PG/12/21/29473, PG/11/59/29004 ML), BHF CRE at Oxford (ML) grants.
0.2 μm syringe filter | Medical equipment factory of Shanghai Medical Instruments Co., Ltd., Shanghai, China | N/A | To filter solution |
15 mL centrifuge tube | Guangzhou Jet Bio-Filtration Co., Ltd. China | CFT011150 | |
1 mL Pasteur pipette | Beijing Labgic Technology Co., Ltd. China | 00900026 | |
1 mL Syringe | B. Braun Medical Inc. | YZB/GER-5474-2014 | |
200 μL PCR tube | Sangon Biotech Co., Ltd. Shanghai. China | F611541-0010 | Aliquote the stock solutions to avoid repeated freezing and thawing |
50 mL centrifuge tube | Guangzhou Jet Bio-Filtration Co., Ltd. China | CFT011500 | Store Tyrode's solution at 4 °C for follow-up heart isolation |
585/40 nm filter | Chroma Technology | N/A | Filter for calcium signal |
630 nm long-pass filter | Chroma Technology | G15604AJ | Filter for voltage signal |
Avertin (2,2,2-tribromoethanol) | Sigma-Aldrich Poole, Dorset, United Kingdom | T48402-100G | To minimize suffering and pain reflex |
Blebbistatin | Tocris Bioscience, Minneapolis, MN, United States | SLBV5564 | Excitation-contraction uncoupler to eliminate motion artifact during mapping |
CaCl2 | Sigma-Aldrich, St. Louis, MO, United States | SLBK1794V | For Tyrode's solution |
Custom-made thermostatic bath | MappingLab, United Kingdom | TBC-2.1 | To keep temperature of perfusion solution |
Dimethyl sulfoxide (DMSO) | Sigma-Aldrich | (RNBT7442) | Solvent for dyes |
Dumont forceps | Medical equipment factory of Shanghai Medical Instruments Co.,Ltd.,Shanghai, China | YAF030 | |
ElectroMap software | University of Birmingham | N/A | Quantification of electrical parameters |
EMCCD camera | Evolve 512 Delta, Photometrics, Tucson, AZ, United States | A18G150001 | Acquire images for optical signals |
ET525/36 sputter coated filter | Chroma Technology | 319106 | Excitation filter |
Glucose | Sigma-Aldrich, St. Louis, MO, United States | SLBT4811V | For Tyrode's solution |
Heparin Sodium | Chengdu Haitong Pharmaceutical Co., Ltd., Chengdu, China | (H51021209) | To prevent blood clots in the coronary artery |
Iris forceps | Medical equipment factory of Shanghai Medical Instruments Co.,Ltd.,Shanghai, China | YAA010 | |
Isoproterenol | MedChemExpress, Carlsbad, CA, United States | HY-B0468/CS-2582 | |
KCl | Sigma-Aldrich, St. Louis, MO, United States | SLBS5003 | For Tyrode's solution |
MacroLED | Cairn Research, Faversham, United Kingdom | 7355/7356 | The excitation light of fluorescence probes |
MacroLED light source | Cairn Research, Faversham, United Kingdom | 7352 | Control the LEDs |
Mayo scissors | Medical equipment factory of Shanghai Medical Instruments Co.,Ltd.,Shanghai, China | YBC010 | |
MetaMorph | Molecular Devices | N/A | Optical signals sampling |
MgCl2 | Sigma-Aldrich, St. Louis, MO, United States | BCBS6841V | For Tyrode's solution |
MICRO3-1401 | Cambridge Electronic Design limited, United Kingdom | M5337 | Connect the electrical stimulator and Spike2 software |
MyoPacer EP field stimulator | Ion Optix Co, Milton, MA, United States | S006152 | Electric stimulator |
NaCl | Sigma-Aldrich, St. Louis, MO, United States | SLBS2340V | For Tyrode's solution |
NaH2PO4 | Sigma-Aldrich, St. Louis, MO, United States | BCBW9042 | For Tyrode's solution |
NaHCO3 | Sigma-Aldrich, St. Louis, MO, United States | SLBX3605 | For Tyrode's solution |
NeuroLog System | Digitimer | NL905-229 | For ECG amplifier |
OmapScope5 | MappingLab, United Kingdom | N/A | Calcium alternans and arrhythmia analysis |
Ophthalmic scissors | Huaian Teshen Medical Instruments Co., Ltd., Jiang Su, China | T4-3904 | |
OptoSplit | Cairn Research, Faversham, United Kingdom | 6970 | Split the emission light for detecting Ca2+ and Vm simultaneously |
Peristalic pump | Longer Precision Pump Co., Ltd., Baoding, China, | BT100-2J | To pump the solution |
Petri dish | BIOFIL | TCD010060 | |
Pluronic F127 | Invitrogen, Carlsbad, CA, United States | 1899021 | To enhance the loading with Rhod2AM |
RH237 | Thermo Fisher Scientifific, Waltham, MA, United States | 1971387 | Voltage-sensitive dye |
Rhod-2 AM | Invitrogen, Carlsbad, CA, United States | 1890519 | Calcium indicator |
Silica gel tube | Longer Precision Pump Co., Ltd., Baoding, China, | 96402-16 | Connect with the peristaltic pump |
Silk suture | Yuankang Medical Instrument Co., Ltd.,Yangzhou, China | 20172650032 | To fix the aorta |
Spike2 | Cambridge Electronic Design limited, United Kingdom | N/A | To record and analyze ECG data |
Stimulation electrode | MappingLab, United Kingdom | SE1600-35-2020 | |
T510lpxr | Chroma Technology | 312461 | For light source |
T565lpxr | Chroma Technology | 321343 | For light source |