We describe here a simple method for expression, extraction, and purification of recombinant human IgG fused to GFP in Nicotiana benthamiana. This protocol can be extended to purification and visualization of numerous proteins that utilize column chromatography. Moreover, the protocol is adaptable to the in-person and virtual college teaching laboratory, providing project-based exploration.
High demand for antibodies as therapeutic interventions for various infectious, metabolic, autoimmune, neoplastic, and other diseases creates a growing need in developing efficient methods for recombinant antibody production. As of 2019, there were more than 70 FDA-approved monoclonal antibodies, and there is exponential growth potential. Despite their promise, limiting factors for widespread use are manufacturing costs and complexity. Potentially, plants offer low-cost, safe, and easily scalable protein manufacturing strategies. Plants like Nicotiana benthamiana not only can correctly fold and assemble complex mammalian proteins but also can add critical post-translational modifications similar to those offered by mammalian cell cultures. In this work, by using native GFP and an acid-stable variant of green fluorescent protein (GFP) fused to human monoclonal antibodies, we were able to visualize the entire transient antibody expression and purification process from N. benthamiana plants. Depending on the experiment's purpose, native GFP fusion can ensure easier visualization during the expression phase in the plants, while acid-stable GFP fusion allows for visualization during downstream processing. This scalable and straightforward procedure can be performed by a single researcher to produce milligram quantities of highly pure antibody or antibody fusion proteins in a matter of days using only a few small plants. Such a technique can be extended to the visualization of any type of antibody purification process and potentially many other proteins, both in plant and other expression systems. Moreover, these techniques can benefit virtual instructions and be executed in a teaching laboratory by undergraduate students possessing minimal prior experience with molecular biology techniques, providing a foundation for project-based exploration with real-world applications.
Industry reports indicate that thirteen out of the twenty most-highly grossing drugs in the United States were biologics (protein-based pharmaceuticals), of which nine were antibodies. As of 2019, there were over 570 antibody (Ab) therapeutics at various clinical development phases1,2,3. Current global Ab sales exceed 100 billion USD, and the monoclonal Ab (mAb) therapeutic market is expected to generate up to 300 billion USD by 20251,4. With such high demand and projected increases in revenue, researchers have been working to develop ways to produce Ab therapeutics on an ever-larger scale, with higher quality and lower-costs. Plant-based expression systems have several advantages over traditional mammalian cell lines for the affordable and large-scale manufacture of Ab therapeutics5,6. Production of protein therapeutics in plants ("molecular pharming") does not require expensive bioreactors or cell culture facilities as do traditional mammalian cell culture techniques7,8. Plants cannot contract human pathogens, minimizing potential contamination9. Both transient and transgenic plant-based protein expression can be utilized as lower-cost alternatives to mammalian or bacterial production systems10. Though transgenic plants are preferred for crop production, recombinant protein production using this method can require weeks to months. Advances in transient expression using viral vectors through either syringe or vacuum agroinfiltration allow for small- and large-scale production, respectively, of the desired protein in days11,12,13,14. Production of mAbs against Ebola, Dengue and, Zika, and numerous other recombinant proteins, have been produced and purified quickly and efficiently using transient expression in N. benthamiana plants15,16,17,18,19. These circumstances make transient plant-based expression an attractive option for developing multiple Ab therapeutics and the methods demonstrated in this protocol20.
First-generation mAbs were of murine derivation, which resulted in non-specific immunogenicity when used in human trials21. Over time, chimeric, humanized, and eventually, fully human Abs were produced to lessen immunogenicity induced by Ab therapeutics. Unfortunately, some of these Abs still cause host immunogenicity due to differences in glycosylation21. Developments in plant engineering have allowed for the modification of Ab glycans, which is essential since an Ab's stability and function can significantly be affected by its glycosylation state22. Advances have allowed production in plant systems of high-level expression of humanized mAbs, containing human glycans and resultantly the desired biological traits of a mass-produced human pharmaceutical19,21.
In addition to recombinant Abs, Ab fusion molecules (Ab fusions) have been explored for various purposes in recent decades. Ab fusions often consist of an Ab or Ab fragment fused to a molecule or protein and are designed to elicit responses from immune effector cells23. These molecules have been created as potential therapeutic interventions to treat various pathologies such as cancer and autoimmune diseases24,25,26,27. Recombinant immune complexes (RICs) are another class of Ab fusions that have been employed as vaccine candidates28. RICs take advantage of the immune system's ability to recognize Fc regions of Ab fusions and have been found to improve immunogenicity when combined with other vaccine platforms29,30,31.
Green Fluorescent Protein (GFP) is a bioluminescent protein derived from the jellyfish Aequorea Victoria, which emits green light when excited by ultraviolet light32,33. Over the years, GFP's use as a visual marker of gene expression has expanded from expression in Escherichia coli to numerous protein expression systems, including N. benthamiana plants34,35,36,37,38. Visible markers, such as GFP, have abundant implications in the teaching and learning of scientific concepts. Numerous entry-level students describe difficulties grasping scientific concepts when the idea being taught is not visible to the naked eye, such as the concepts of molecular biology and related fields39. Visual markers, like GFP, can thus contribute to the processing of information related to the scientific processes and could help lessen the difficulties students report in learning numerous scientific concepts.
Although GFP is often used as a marker to indicate gene and expression in vivo, it is difficult to visualize it in the downstream processes if using acidic conditions. This circumstance is primarily because GFP does not maintain its structure and resultant fluorescence at a low pH40. Temporary acidic environments are often required in various purification processes, such as protein G, protein A, and protein L chromatography, often utilized for Ab purification41,42,43,44. GFP mutants have been used to retain fluorescence under acidic conditions45,46.
Herein we describe a simple method for expression, extraction, and purification of recombinant IgG fusion proteins in N. benthamiana plants. We produced traditional GFP fused to the N-terminus of a humanized IgG heavy chain, creating a GFP-IgG fusion. Simultaneously, we developed the fusion of a plant codon-optimized sequence for an acid-stable GFP (asGFP) to the N-terminus of a humanized IgG heavy chain, creating an asGFP-IgG fusion. The advantages of producing GFP-IgG include the ability to visualize the presence of a target protein during expression, while asGFP-IgG allows seeing the presence of recombinant protein in not only the expression and extraction steps but also in the purification steps of the protein. This protocol can be adapted for the production, purification, and visualization of a range of GFP fusion proteins produced in N. benthamiana and purified using chromatography techniques that require low pH. The process can also be tailored to various amounts of leaf material. While Abs and fusion proteins tagged with GFP or asGFP are not intended to be used for therapies, these methods can be useful as controls during experiments and can also be further utilized as a teaching tool for molecular and cellular biology and biotechnology, both in-person and virtually.
1. Cultivate N. benthamiana plants
2. Preparation of Agrobacterium tumefaciens for infiltration
NOTE: GFP-IgG fusion constructs can be obtained as described in this paper31. The asGFP gene was obtained and plant-optimized from this study45. The following steps must be done next to a Bunsen burner, and basic aseptic techniques should be applied to avoid contamination.
3. Needle-less syringe agroinfiltration
4. Grow and observe the infiltrated N. benthamiana
5. Protein extraction
6. Protein G column chromatography procedure
NOTE: The protocol described here is for gravity-flow chromatography using Pierce Protein G agarose resin. If using a different resin, refer to the manufacturer's instructions for adjustments. Never let the resin run dry and prevent all liquid from draining out. Recap the outlet as needed.
7. SDS-PAGE for GFP-Ig fusion detection
This study demonstrates an easy and fast method to produce recombinant proteins and visualize them throughout downstream processes. Using N. benthamiana and following the provided protocol, recombinant protein production described here can be achieved in less than a week. The overall workflow of plant expression, extraction, and purification is shown in Figure 1. The stages of plant growth from 2-week old seedlings, 4-week old plants, and 6-week old plants are displayed in Figure 1A (1-3), respectively, while Figure 1B depicts leaf morphological changes due to necrosis (Figure 1B-1) or chlorosis (Figure 1B-2). Necrosis may occur at the injection site between days 3-5 after infiltration. These changes often depend on the protein's properties being expressed and the infiltrated plants' health (further examined in discussion). Simultaneously, chlorosis can also rely on the health of plants being used (further examined in discussion). The process of Agrobacterium growth and preparation for infiltration is shown in Figure 1C. Figure 1C-1 displays isolated colonies of Agrobacterium. Figures 1C (2-5) display the media's expected appearance after it is inoculated with a single isolated colony. Refer to Figure 3 for more details on these steps. The plant infiltration process is shown in Figure 1D and begins with an un-infiltrated plant and is followed by the infiltration process. The expression, extraction, and clarification of plant proteins are displayed in Figure 1E. The leaf material is placed in a blender and is homogenized, shown in Figures 1E (1-3). A sample representing total homogenate is then taken. It is then filtered through a Miracloth (gauze or even a coffee filter can substitute for reduced expenses), and the clarified suspension is centrifuged. The centrifugation allows for the separation of the supernatant from the remaining materials, as shown in Figures 1E (4-6). The clarified supernatant is then loaded on a protein G affinity chromatography column, Figure 1F (1-3). After most of the protein is bound, Figure 1F-4, the proteins are eluted from the resin Figure 1F (5,6).
Table 1 displays the plant optimized nucleic acid sequences used to produce asGFP45 (upper row) in the pBY!KEAM-GFPasH vector used in this study to express asGFP-IgG fusion and GFP33 (lower row) in the PBYEAM-GFPHgp vector used in this study to express GFP-IgG fusion. Nucleic acid sequences were examined using the Expasy protein translate tool (https://web.expasy.org/translate/) to determine amino acid sequences.
A representative Agrobacterium plate prepared using this protocol is shown in Figure 2. Desired colonies should appear round and uniform in shape and color. Colonies closer to the center of the plate have a higher likelihood of expressing kanamycin resistance. The liquid cultures will be prepared from a single isolated colony.
The expected appearance of media containing cultures is shown in Figure 3. Upon initial inoculation of an isolated colony, LB media will appear light yellow and translucent, as shown in Figure 3A. After incubation of an isolated colony overnight at 30 °C, LB media will appear turbid. As shown in Figure 3B, objects can no longer be seen through the media when growth is present in the LB. Following centrifugation, a pellet should form at the bottom of the tube. The tube will have a clear separation of LB media above the pellet and will appear light yellow and translucent, as shown in Figure 3C. The LB media supernatant is disposed of, and the pellet is resuspended in the infiltration buffer. At an OD600 of 0.2, the media will appear turbid, as shown in Figure 3D. OD600 should be measured as described in the methods.
Figure 4 represents the process of leaf infiltration. A slight prod of the leaf with a paperclip should yield a break in the leaf epidermis that does not pass entirely through the leaf. The break should barely pierce the leaf so the infiltration buffer can be injected into the leaf, shown in Figure 4A-C. The suspension of Agrobacterium and infiltration buffer is injected directly into the break in the leaf and slightly alters the infiltrated leaf's color; see Figure 4D-F.
The appearance of leaves expressing IgG fusions is represented in Figure 5. It displays leaves that express asGFP-IgG fusions (Figure 5A) and GFP-IgG fusions (Figure 5C) under white light. If the constructs in this protocol are used, when infiltrated at a 0.2 OD600, leaves should appear healthy on days 1-5 for both leaves expressing asGFP-IgG fusions and leaves expressing GFP-IgG fusions. There may be a slight necrotic appearance at injection sites on day 5, which is usually apparent by the lightening of the plant tissue in those areas. Figure 5 also displays leaves expressing asGFP-IgG fusions (Figure 5B) and GFP-IgG fusions (Figure 5D), respectively, under long-wave UV light from the leaf's top view. Fluorescence increases in intensity as the days progress for both constructs expressed. Leaves expressing asGFP-IgG fusions tend to have slightly less intense fluorescence than leaves expressing GFP-IgG fusions on all days.
When the supernatant of the asGFP-IgG extract is added to the Protein G column, the resin will become slightly green under white light due to plant chlorophyll pigments (Figure 6A). The addition of supernatant under short-wave UV light results in the accumulation of fluorescence in the Protein G resin, as shown in Figure 6B. Note that the supernatant will also be fluorescent alone under UV light. Still, fluorescence is expected to be much more concentrated when the asGFP-IgG fusion begins to bind to the resin.
Following the passing of supernatant of asGFP-IgG through the protein G resin, the resin should illuminate under short wave UV light, as shown in Figure 7A. At this point, most of the IgG will be bound to the resin. Upon adding the elution buffer, the fluorescence contained in the protein G resin will still be visible under short-wave UV light and will begin to lose intensity as more elution buffer of low pH passes through the resin. Fluorescence will start to accumulate in the eluates (Figure 7B). Eluate fractions will vary in fluorescence. As seen in Figure 8, fluorescence is the lowest intensity in the first elution and highest intensity in the second and third eluates. Results may vary, as the fluorescence will depend on the protein's expression, harvested leaf material, and other conditions used in the experiment.
After finishing the purification process, samples are analyzed on the 10% SDS-PAGE gel under reducing conditions (sample buffer contains DTT and samples were boiled for 5 min) and non-reducing conditions (sample buffer does not contain DTT and samples were not boiled). As shown in Figure 9A, only non-reducing samples, such as in Elution 2 NR lane, will fluoresce when exposed to short wave UV light. This lane's first band is fluorescing at the full product's expected size ~200 kDa, indicating that the asGFP is still conformationally correct. The fluorescent bands near the bottom of the gel are dye from the reducing buffer. Note that asGFP loses fluorescence when exposed to temperatures at or above 95 °C for 5 minutes; this is different from eGFP (enhanced GFP), which would maintain some fluorescence under the same conditions49,50. Two bands of the ladder, 75 kDa and 25 kDa, also fluoresce. Figure 9B represents a Coomassie stain of the same gel in Figure 9A. Elutions in lanes 6-9 have been prepared under reducing conditions. When run on a gel and Coomassie-stained, these samples should display the asGFP-IgG fusion components separately. These components include the heavy chain fused to GFP (~75 kDa), the heavy chain alone (50 kDa), the light chain (25 kDa), and the asGFP itself (27 kDa). The non-reducing sample was included in the last lane of the gel for comparison purposes and should display a single large band (~200 kDa), which should be made up of two heavy chains fused to the asGFP and respective light chains. Additionally, smaller bands are likely caused by native proteases. This cleavage can be prevented with the addition of protease inhibitors and by keeping the protein extract cold at all times, including when performing the column purification. The IgG fusion protein's individual components will not be distinguishable in the non-reducing samples on the Coomassie gel.
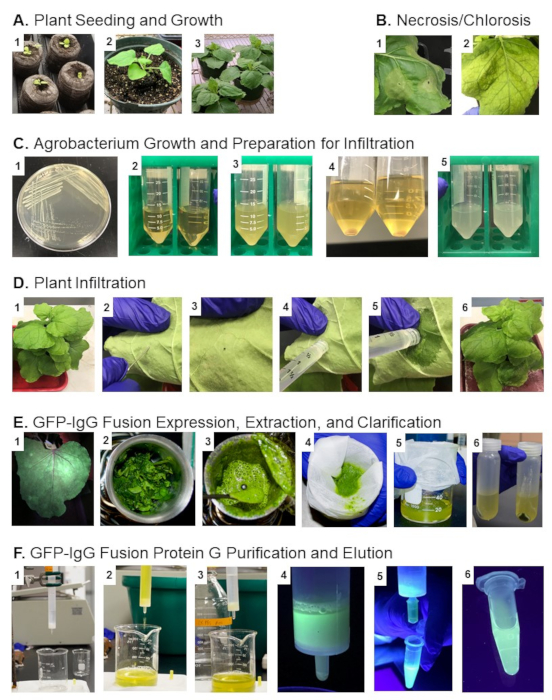
Figure 1: Workflow of plant expression, extraction, and purification processes. Please click here to view a larger version of this figure.
Nucleotide Sequence Used | Amino Acid Sequence | ||
Sequences used for asGFP in pBY!KEAM -GFPasH vector used in the expression of the asGFP-IgG fusion |
ATGGTGTCCAAGGGAGAGGAAGCTTCTGGAAGAGCCTTGTTC CAGTACCCTATGACTTCTAAAATCGAGTTGAATGGCGAGATCA ACGGAAAGAAGTTTAAGGTTGCTGGAGAGGGTTTCACCCCTTC ATCTGGAAGATTCAATATGCACGCTTACTGTACTACCGGAGAC TTGCCTATGTCCTGGGTTGTTATAGCTTCCCCGCTTCAGTACGG GTTTCACATGTTTGCCCACTACCCTGAGGATATCACTCACTTCTT CCAAGAATGTTTTCCTGGGTCTTATACTCTCGACAGAACTTTGA GGATGGAGGGAGACGGTACTCTTACTACTCACCACGAGTACTC CCTTGAGGACGGTTGCGTTACTTCCAAGACTACTTTGAACGCTT CTGGATTCGACCCCAAGGGAGCCACTATGACTAAGTCTTTCGT CAAACAGCTCCCAAACGAGGTCAAAATCACCCCACACGGGCCA AATGGTATTAGACTTACTTCCACTGTTCTCTACCTTAAGGAGGA CGGAACTATCCAGATCGGAACTCAAGACTGCATCGTTACCCCA GTTGGCGGCAGAAAAGTTACTCAGCCTAAGGCTCACTTTCTTC ATACTCAGATCATTCAGAAGAAGGACCCAAACGACACCAGAG ATCACATCGTTCAGACTGAGCTTGCCGTTGCTGGAAATCTTTG GCACGGCATGGATGAGCTTTACAAGA |
MVSKGEEASGRALF QYPMTSKIELNGEI NGKKFKVAGEGFTP SSGRFNMHAYCTT GDLPMSWVVIASPL QYGFHMFAHYPEDI THFFQECFPGSYTL DRTLRMEGDGTLTT HHEYSLEDGCVTSK TTLNASGFDPKGAT MTKSFVKQLPNEVK ITPHGPNGIRLTSTV LYLKEDGTIQIGTQD CIVTPVGGRKVTQP KAHFLHTQIIQKKDP NDTRDHIVQTELAV AGNLWHGMDELY K |
|
Sequences used for GFP in pBYEAMGFPHgp vector used in the expression of GFP-IgG fusion |
ATGGCTAACAAGCACCTCTCATTGTCTCTCTTCCTTGTGCTCCTT GGTCTTTCTGCTTCTCTTGCTTCTGGTATGGTGAGCAAGGGCG AGGAGCTGTTCACCGGGGTGGTGCCCATCCTGGTCGAGCTGG ACGGCGACGTAAACGGCCACAAGTTCAGCGTGTCCGGCGAGG GCGAGGGCGATGCCACCTACGGCAAGCTGACCCTGAAGTTCA TCTGCACCACCGGCAAGCTGCCCGTGCCCTGGCCCACCCTCGT GACCACCTTCAGCTACGGCGTGCAGTGCTTCAGCCGCTACCCC GACCACATGAAGCAGCACGACTTCTTCAAGTCCGCCATGCCCG AAGGCTACGTCCAGGAGCGCACCATCTTCTTCAAGGACGACGG CAACTACAAGACCCGCGCCGAGGTGAAGTTCGAGGGCGACAC CCTGGTGAACCGCATCGAGCTGAAGGGCATCGACTTCAAGGA GGACGGCAACATCCTGGGGCACAAGCTGGAGTACAACTACAA CAGCCACAACGTCTATATCATGGCCGACAAGCAGAAGAACGG CATCAAGGTGAACTTCAAGATCCGCCACAACATCGAGGACGGC AGCGTGCAGCTCGCCGACCACTACCAGCAGAACACCCCCATCG GCGACGGCCCCGTGCTGCTGCCCGACAACCACTACCTGAGCAC CCAGTCCGCCCTGAGCAAAGACCCCAACGAGAAGCGCGATCA CATGGTCCTGCTGGAGTTCGTGACCGCCGCCGGGATCACTCAC GGCATGGACGAGCTGTACAAGA |
MANKHLSLSLFLVLL GLSASLASGMVSKG EELFTGVVPILVELD GDVNGHKFSVSGE GEGDATYGKLTLKFI CTTGKLPVPWPTLV TTFSYGVQCFSRYP DHMKQHDFFKSA MPEGYVQERTIFFK DDGNYKTRAEVKFE GDTLVNRIELKGIDF KEDGNILGHKLEYN YNSHNVYIMADKQ KNGIKVNFKIRHNIE DGSVQLADHYQQN TPIGDGPVLLPDNH YLSTQSALSKDPNEK RDHMVLLEFVTAA GITH |
Table 1: Sequences used to create asGFP and GFP
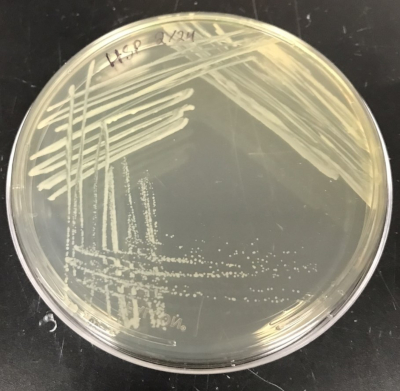
Figure 2: Agrobacterium colonies grown on LB plate containing kanamycin. Please click here to view a larger version of this figure.
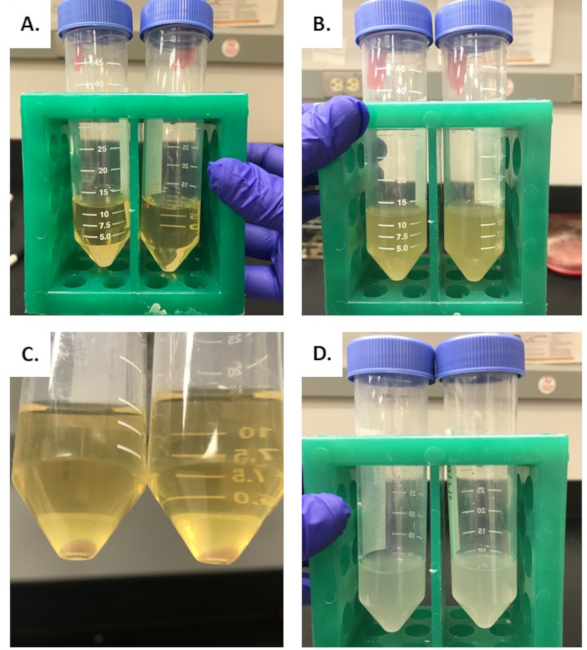
Figure 3: Appearance of media throughout the growth and processing of Agrobacterium. (A) The appearance of LB media immediately following inoculation of isolated Agrobacterium colony. (B) The presence of media after overnight incubation of an isolated colony at 30°C. (C) The appearance of media after cultures are spun down for 20 min at 4,500 x g. (D) Pellet resuspended in the infiltration buffer. Please click here to view a larger version of this figure.
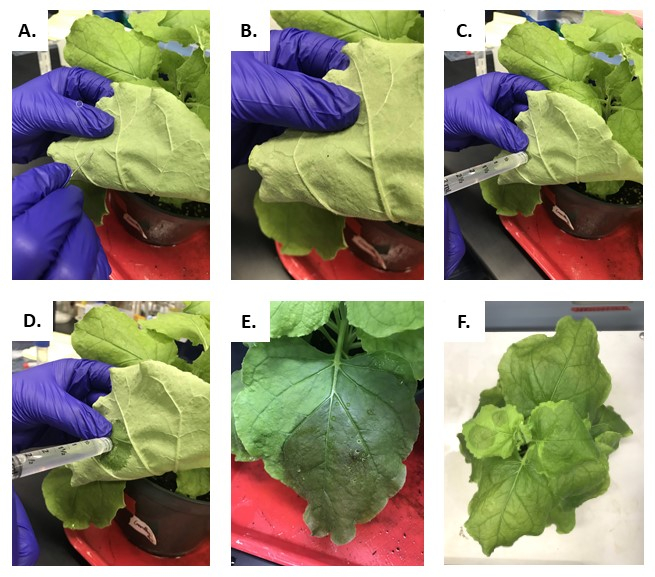
Figure 4: Process of infiltration of N. benthamiana plants. (A-B) Slightly poking the leaf results in a subtle hole at the top of the leaf. (C-D) Injection of Agrobacterium suspension into leaf. (E) Infiltrated Plant leaf from the top view. (F) Plant with multiple leaves infiltrated from the top view. Please click here to view a larger version of this figure.
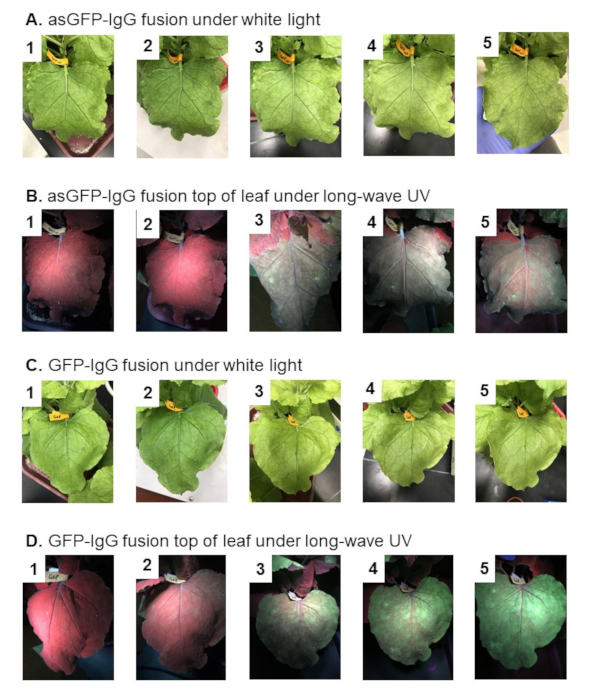
Figure 5: Visualization of leaves containing asGFP-IgG fusion and GFP-IgG fusion begin on day 1 post infiltration (dpi) in the first row, leading up to day 5 dpi in the last row for all conditions. A) asGFP-IgG fusion under white light. B) asGFP-IgG fusion under long-wave UV. C) GFP-IgG fusion under white light. D) GFP-IgG fusion under long-wave UV. Please click here to view a larger version of this figure.
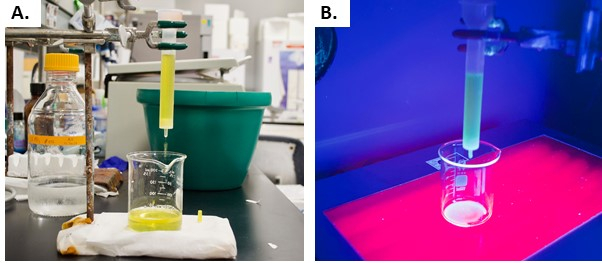
Figure 6: Supernatant of the asGFP-IgG extract being added to the Protein G column. A) Addition under white light. B) Addition under short wave UV light. Please click here to view a larger version of this figure.
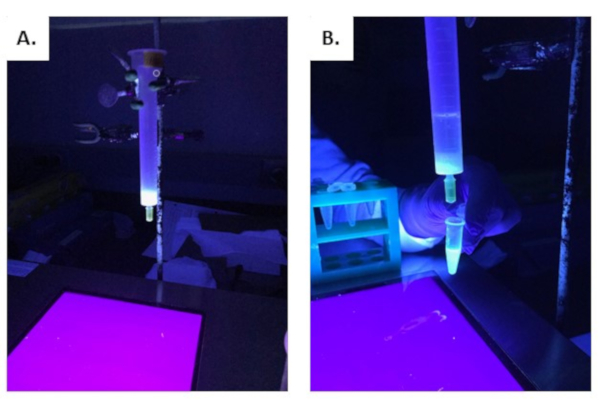
Figure 7: Protein G resin under short-wave UV light after supernatant of the asGFP-IgG extract was run through the column. A) Protein G resin under short-wave UV light. B) Protein G resin upon elution of proteins under low PH conditions. Please click here to view a larger version of this figure.
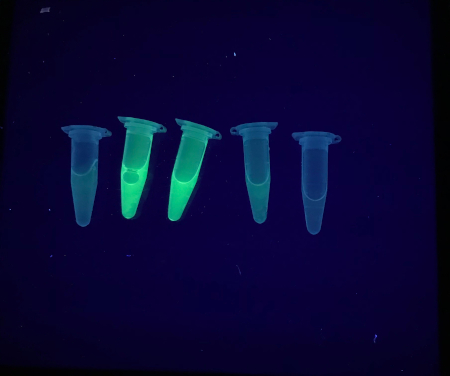
Figure 8: Purified elutions of asGFP-IgG obtained after exposure to low pH conditions through purification. Please click here to view a larger version of this figure.
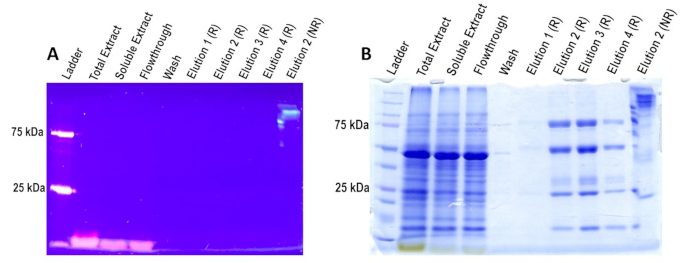
Figure 9: SDS-PAGE of Column Samples. Samples labeled with "R" are in reducing conditions, and samples labeled with "NR" are in non-reducing conditions. A) Under UV light, only non-reducing samples fluoresce in the 10% polyacrylamide gel, as seen in Elution 2 NR lane. The 75 kDa and 25 kDa ladder bands also fluoresce. B) Coomassie staining of the same gel reveals the presence of all proteins in the sample. In the reduced elutions, the IgG fusion without light chain, the heavy chain, light chain, and possibly degraded GFP are present at ~75 kDa, ~50 kDa, ~25 kDa, and ~10 kDa, respectively. In contrast, in the non-reduced elutions, one prominent band is present, consistent with the size of the entire asGFP-IgG fusion (~200 kDa). Please click here to view a larger version of this figure.
This protocol can be utilized for the visual verification of any recombinant Ab or recombinant protein produced in N. benthamiana plants, including those that require temporary exposure to acidic environments for column purification purposes42,43,44. Furthermore, the fusion of asGFP to other proteins in different expression systems can be a useful tool for experimental visualization and education. The protocol herein can further be scaled to larger and smaller amounts of leaf material to produce the desired amount of recombinant protein. The described methods take advantage of previous studies that have identified and made versions of GFP that remain stable under acidic conditions46. Comprehensive prior studies have created immunoglobulin domains fused to a protein of interest, often termed IgG-fusions, which this protocol can also accommodate28. By creating and expressing an IgG-fusion composed of a humanized IgG1 fused to a GFP and asGFP, we were able to visualize the presence of the desired protein during the expression, extraction, and purification processes.
If a skilled researcher follows this protocol, leaves will begin to display necrosis signs at the infiltration sites between days 4-5. However, when using the described vectors, infiltrated areas of leaves should appear healthy up until day 5 with proper care. It is important to note that Agrobacterium infection on its own will eventually result in necrosis of the plant leaves due to the accumulation of reactive oxygen species (ROS) as part of the plant cell immune response51,52. This immune response and the resultant level of necrosis can vary based on several factors51, including the cellular targeting, the protein's location, the type of protein being produced, the expression vector, and the strain of Agrobacterium used53,54. Also, variations in the optical density (OD600) of the Agrobacterium used for infiltration can affect the levels of necrosis55. Many expression vectors utilize proteins that bind retinoblastoma protein to keep the plant cells in synthesis (S)-phase and increase cell division and transformation frequency56,57. Increases in protein production, such as those caused by binding to retinoblastoma protein, can lead to necrosis56,57. Advances in vector design, such as those used in modified versions of the geminivirus BeYDV replicons used in this protocol, have minimized necrosis while maintaining high protein expression levels58. Also, BeYDV replicons are non-competing, providing expression of multiple proteins on a single cassette without known size limitations53,59.
Several factors affect plant growth before and after infiltration, which might eventually lead to low protein yield. When seeding plants, too many seeds per plant pellet can result in many small plant sprouts leading to more modest plant growth. Hence, reducing the seed number per peat pellet and removing the extra sprouts after a week will result in better plant growth. Maintaining proper soil moisture is another factor affecting overall plant health. Overwatering, underwatering, adding too much or too little fertilizer might contribute to chlorosis and affect the plant health60,61,62. Necrosis and chlorosis can additionally be caused by the production of a protein that causes cell stress. This phenomenon has been seen many times with the expression of recombinant immune complexes (RIC)56. We have observed that changes in protein structure and fusion of proteins can help minimize necrosis; however, some proteins can remain toxic to plants even after various modifications. If using the expression vectors outlined herein, extraction of protein may be performed early and before the onset of significant necrosis, resulting in high protein yield56.
Different growth conditions can slow or even inhibit Agrobacterium growth. Agrobacterium grows optimally at 28 °C-30 °C and experiences a heat shock when incubated above 30 °C, producing cell division errors62. Growth can also be impeded by the addition of too much rifampicin, as different Agrobacterium strains are more or less naturally resistant to this antibiotic62. The bacterial culture prepared for infiltration with significantly higher OD600 than recommended will likely cause necrosis55. A slightly higher OD600 of the culture usually does not affect the yield, but if it is lower than 0.1, the protein yield might be considerably reduced. Accumulation of dead cells can occur under two circumstances; 1) the culture was overgrown, leading to a significant fraction of the OD being dead cells, and 2) damaging/killing the Agrobacterium after growth, such as with chemical residue or high centrifuge speeds. Infiltrations using an increased number of dead cells in the culture might reduce protein expression. Moreover, puncturing the leaves by applying too much pressure can damage the leaves and hence might lead to premature necrosis. Considering these possible factors when expressing recombinant proteins in Nicotiana benthamiana, can lead to enhanced protein production.
Obtaining low protein yield could be due to some issues in the extraction and purification steps. Firstly, the extraction buffer might need optimization depending on the protein of interest. During blending, plant material should be homogenous without any visible leaf pieces. Next, some proteins require detergents for solubilization in the extraction buffer, such as Tween-20 or Triton. Other proteins might need urea at high concentrations ~7.5 M for solubilization, while some can be extracted with PBS only. Degradation of protein can occur if buffers, plant tissue, centrifuges, etc. are not kept cool during the extraction process. Lack of protease inhibitors and sodium ascorbate or similar chemicals in the extraction buffer can also cause degradation or aggregation. Some protease inhibitors like PMSF degrade quickly, and sodium ascorbate takes some time to become aqueous. Overall, researchers should determine optimal conditions for their protein of interest.
The purification of IgG-fusions includes few steps that might need modifications if low protein yield is obtained. Analyzing the sample aliquots collected during the entire process by SDS-PAGE and Western will help to identify the fault of the methods. For example, if the flowthrough contains a substantial amount of protein, then the binding of the protein can be facilitated by changing the pH of the buffer. Using high concentrations of detergents during the extraction process might affect the binding property of the resin, especially if the resin is reused several times. Proper storage of the resin, as described in the methods, is vital for the resin's lifespan. Moreover, if the washing step removes the protein of interest from the resin, the buffers might need to be remade to solve this problem. Other issues with protein purification might be due to misfolded or degraded proteins, which might require further analysis of the overall protein design. Referencing the described troubleshooting may increase the efficiency of the purification using this protocol.
The described GFP-IgG fusion purification is helpful in a teaching environment. Visualization is fundamental to science education because it allows learners to comprehend concepts more easily39. Students often report misunderstandings in addition to difficulty understanding concepts at the molecular level39. In particular, the experiments that require an understanding of the specific protein location at each step can be modified by tagging protein of interest with fluorescent molecules. Therefore, GFP or asGFP, depending on the pH environment used, can be utilized to harness their fluorescence to facilitate elucidation of the protein purification technique for students.
In summary, we describe a simple method for expression and purification of a recombinant Ab fused to a GFP in N. benthamiana plants. This protocol can be used for the purification of an Ab fused to any desired target protein. The process can be edited to accommodate various amounts of leaf material and allows for visual determination of protein presence before, during, and after the conclusion of the protein extraction and purification process. These methods can be useful as controls and can be purposed for teaching techniques.
The authors have nothing to disclose.
We thank Maria Pia DiPalma for editing the video. We also thank the Office of Educational Outreach and Student Services at Arizona State University for their generous publication fee assistance. Research for this protocol was supported by the School of Life Sciences, Arizona State University.
5 mL syringe | any | N/A | |
50 mL syringe | any | N/A | |
Agar | SIGMA-ALDRICH | A5306 | |
Blender with cups | any | N/A | |
Bromophenol blue | Bio-Rad | 1610404 | |
DTT (DL-Dithiothreitol) | MP BIOMEDICALS | 219482101 | |
EDTA (Ethylenedinitrilo)tetraacetic acid | SIGMA-ALDRICH | E-6760 | |
Ethanol | any | N/A | |
Glycerol | G-Biosciences | BTNM-0037 | |
Glycine | SIGMA-ALDRICH | G7126-500G | |
HCl (Hydrochloric acid) | EMD MILLIPORE CORPORATION | HX0603-4 | |
Heating block | any reputable supplier | N/A | |
Jiffy-7 727 w/hole peat pellets | Hummert International | 14237000 | |
Kanamycin | Gold Biotechnology Inc | K-120-100 | |
KCl (Potassium Chloride) | SIGMA-ALDRICH | P9541-500G | |
KH2PO4 (Potassium Phosphate) | J.t.baker | 3248-05 | |
KOH (Potassium Hydroxide) | VWR | BDH0262 | |
Magnesium sulfate heptahydrate | SIGMA-ALDRICH | M2773 | |
MES (2-(N-Morpholino)ethanesulfonic acid) | SIGMA-ALDRICH | M8250 | |
Miracloth | Millipore | 4 75855-1R | |
Moisture control potting mix | Miracle-Gro | 755783 | |
Na2HPO4 (Sodium Phosphate) | J.t.baker | 3827-01 | |
NaCl (Sodium Chloride) | Santa Cruz Biotechnology | sc-203274C | |
Nicotiana benthamiana seeds | any reputable supplier | N/A | |
PMSF (Phenylmethylsulfonyl Fluoride) | G-Biosciences | 786-787 | |
Polypropylene Column | any | N/A | |
Precision Plus Protein Dual Color Standards | Bio-Rad | 1610394 | |
Protein G resin | Thermo Fisher Scientific | 20399 | |
Rifampicin | Gold Biotechnology Inc | R-120-25 | |
SDS (Sodium Dodecyl Sulfate) | G-Biosciences | DG093 | |
Sodium Ascorbate | SIGMA-ALDRICH | A7631-500G | |
Spectrophotometer | any reputable supplier | N/A | |
Titan3 0.75 µm glass fiber filter | ThermoScientific | 40725-GM | |
Tray for peat pellets with dome | any | N/A | |
TRIS Base | J.t.baker | 4109-02 | |
Tris-HCl | Amresco | M108-1KG | |
Tryptone | SIGMA-ALDRICH | 17221 | |
UV lamp | any | N/A | |
Water Soluble All Purpose Plant Food | Miracle-Gro | 2000992 | |
Yeast extract | SIGMA-ALDRICH | 9182 |