We measured the tension release in an axon that was partially lesioned with a laser dissector by simultaneous force spectroscopy measurement performed on an optically-trapped probe adhered to the membrane of the axon. The developed experimental protocol evaluates the axon adhesion to the culture substrate.
The formation of functional connections in a developing neuronal network is influenced by extrinsic cues. The neurite growth of developing neurons is subject to chemical and mechanical signals, and the mechanisms by which it senses and responds to mechanical signals are poorly understood. Elucidating the role of forces in cell maturation will enable the design of scaffolds that can promote cell adhesion and cytoskeletal coupling to the substrate, and therefore improve the capacity of different neuronal types to regenerate after injury.
Here, we describe a method to apply simultaneous force spectroscopy measurements during laser induced cell lesion. We measure tension release in the partially lesioned axon by simultaneous interferometric tracking of an optically trapped probe adhered to the membrane of the axon. Our experimental protocol detects the tension release with piconewton sensitivity, and the dynamic of the tension release at millisecond time resolution. Therefore, it offers a high-resolution method to study how the mechanical coupling between cells and substrates can be modulated by pharmacological treatment and/or by distinct mechanical properties of the substrate.
Optical microscopy is one of the less invasive imaging system available to observe living cells. With the exploitation of effects such as radiation pressure (as in optical tweezers1), or high-energy photon flux (as in laser dissector2), this technology was extended to nano-manipulation. The optical imaging system furnishes a precise control to visualize and manipulate sub cellular targets3. At the same time, thanks to the accurate calibration of the delivered laser power, optical tools accomplish either soft or invasive sample manipulation with unprecedented reproducibility.
Several laboratories integrated, in the same experimental setup, optical tweezers and laser dissector in order to ablate organelles4, to fuse together different cells5, or to stimulate cells by optically driven cargos6,7. While optical tweezers, after calibration of the optical stiffness, allow for the control of applied force to the cell on a piconewton scale, laser dissection systems can modulate optical manipulation, which ranges from membrane photo-poration to ablation of single organelles or dissection of sub-cellular structures. However, laser dissection calibration relies on qualitative assessment of the entity of optical manipulation with respect to the energy delivered to the sample, mainly based on image analysis illustrating morphological changes caused to the specimen8. In the presented method, we demonstrate how to perform force spectroscopy measurement during the laser axonal dissection of a developing neuron, to quantify, on piconewton scale, the force produced by an altered equilibrium in the cytoskeleton structure of a sub-cellular compartment9. Cultured neurons adhere to the substrate, and polarize during development. The polarization phase occurs during the first five days in vitro. At stage two of polarization, one of the extruding neurites becomes longer, and it will differentiate to become the axon10. Axonal elongation in response to towing force at the growth cone has been previously modeled by Dennerl’s model11. Recently, this model has been extended12 to include the role of neurite adhesion to the extracellular matrix substrates. This biophysical model, proposed after experimental observations13, showed that pulling forces on growth cone, propagating along the neurite, are modulated by focal adhesions to the substrate. Likewise, axonal lesion produces a local release of tension propagating toward the cell body. Thus, we proposed that measuring such released tension in a location along the axon between the lesion and the cell soma offers the possibility to assess the dampening outcome of unaffected focal adhesions.
We calibrate the necessary energy photon-flux of the laser dissector to control the extent of the inflicted axonal damage, from complete transection to partial lesion. Following the calibration, we repeated partial lesion to the axons of several differentiating neurons and developed the protocol to quantify the tension release, and thus obtained a quantitative parameter to estimate the adhesion of the axon to the substrate14.
In the present work, we describe in detail the developed protocol, which represents a precise experimental procedure to evaluate and compare with piconewton sensitivity the axonal adhesion to the substrate in different experimental conditions such as chemical treatment14, or different types of cell culture support.
1. Optical Setup
The entire optical system was described earlier15. Briefly, the optical tweezers system is based on an ytterbium continuous wave (CW) fiber laser operating at 1064 nm (IPG Laser GmbH). A spatial light modulator (SLM) (LCOS-SLM, model X10468-07 – Hamamatsu) varies the phase of the incoming IR laser beam to control the position of the trapping focus spot on the culture dish by computer generated holograms. The freely available Blue-tweezers software (web link on equipment table) generated holograms projected on the spatial light modulator. The interferometer for force spectroscopy measurements was based on a four-quadrant photodiode (QPD, S5980 with C5460SPL 6041 board – Hamamatsu) and a photodiode (PD, PDA100A-EC – Thorlabs).
The laser dissection source was a pulsed sub-nanosecond UV Nd:YAG laser at 355 nm (PNV-001525-040, PowerChip nano-Pulse UV laser – Teem Photonics). An acousto-optic modulator (MQ110-A3-UV, 355 nm fused silica -AA-Opto-electronic) controlled the power of the UV laser delivered to the sample.
The holographic optical tweezers and laser micro-dissector were integrated on a modified upright microscope (BX51 – Olympus) equipped with a 60X, 0.9 NA water dipping objective.The stage of the microscope is composed of a 3-axis linear DC motor micro-positioning system (M-126.CG1, Physics-Instruments) carrying a separate 3-axis piezoelectric nano-positioning stage (P-733.3DD, Physics-Instruments) to combine coarse movement of the sample with the sub-nanometer resolution of the piezo-stage. The microscope stage system was equipped with two control loops synergistically acting to maintain the trapping focus spot at the right position, depending on the selected working mode (position or force clamp, static or dynamic)16. In particular, an internal feedback loop acts on a piezoelectric stage, to keep the bead at a selected distance from the trap center. The other external loop controls the position of the motorized stage to exploit the region spanned by the piezo-actuator on a larger area than its available stroke17. When the piezo-stage reaches the limit of the available stroke in one direction, the external loop moves the micro stage in the opposite direction, thus the piezo recovers toward its central position because it is tracking the trapped bead adhered to the sample. When the piezo-stage reaches the central position of its course range, the micro stage halted. Further details of the system are reported in Guiggiani et al16,17.
A Peltier device (QE1 resistive heating with TC-344B dual channel heater controller – Warner Instruments) controls the temperature of the cell culture under the microscope (37 °C). In the culture, pH and humidity were maintained at physiological conditions by aerating a custom-designed polydimethylsiloxane (PDMS) sleeve (integrating the microscope objective) with humidified carbogen (95% O2, 5% CO2).
2. Cell Culture Preparation
All the experimental protocols were approved by the Italian Ministry of Health. Primary cultures were obtained from hippocampi of mice (C57BL6J, Charles River) at embryonic day 18 (E18).
3. Bead Coating
4. Choose Isolated Neuron. Detach A Bead from the Culture Substrate, Trap and Move it Next to the Neuron
5. Move the Trap Position with Respect to the Laser Dissector Spot and Axon Position by Computer Generated Hologram, and Calibrate the Optical Tweezers Stiffness
6. Attach the Bead to the Axon. Perform Axotomy and Simultaneous Force Measurement
7. Quantify the Total Tension Release
The cell generates traction forces on the substrate by its focal adhesions. Force generated by cytoskeletal elements are in equilibrium with the counteracting force of the culture substrate. After laser induced lesion of the neurite, some of the tensed cytoskeleton cables are disrupted and their equilibrated tension is released because the opposing force of the substrate adhesion is eliminated. The released tension is partially distributed on the unaffected focal adhesions, and the bead attached to the cell membrane, held in an optical trap, measures the portion of such release not counteracted by cytoskeletal elements anchoring the cell to the substrate (see schematic Figure 1).
We report, in Figure 2, a representative result of the above-described experimental protocol. The neuron, in Figure 2a left panel, presents a longer neurite, which identifies the axon of the differentiating neuron. In Figure 2a right panel, the same neuron is shown after the induced axonal lesion (indicated by the white arrow). Figure 2b shows the recorded bead displacement traces in x, y, and z directions. Figure 2c reports the video tracking of a scratch on the glass support, to take into account and eliminate the stage drift during the measurement.
In Figure 3a, on the left panel, we show the lesioned neurite, and the white line upstream the lesion site, where we calculate the kymograph of the neurite diameter during the tension release measurement. On the right panel is the kymograph, showing how the neurite diameter slightly increases immediately after the lesion, and then becomes thinner due to the release of tension toward the cell soma. In Figure 3b, we quantify the kymograph result. The neurite appears brighter with respect to the background since we positioned the attached bead in the focus center of the objective, and therefore the axon is slightly out of focus. Indeed, by reporting the sum of pixel intensities along the kymograph line at each frame of the time-lapse video recording, we obtain an estimate of the neurite diameter during the release of tension. On panel 3c, we report the total variance of the attached bead during the tension release, calculated based on the traces recorded by the interferometer (in Figure 2b) after high pass filtering at 10 Hz cut-off frequency. We can observe that the variance increases with the neurite diameter during accumulation of material upstream of the lesion site. Then, the variance starts to decrease (at t0 in Figure 3c) when the membrane is strained, and the neurite diameter decreases too. The variance decrease reaches a plateau (at t1 in Figure 3c), when the tension release ceases. After t1, the Brownian motion starts to increase because of membrane relaxation possibly due to exocytosis21 (see Figure 3c).
In Figure 4a, the white box indicates the estimation of the neurite contact area Aaxon with the culture support. Aaxon is calculated between the UV laser spot position and the center of the trapped probe. Figure 4b reports the amplitude trace of the total released force Freleased obtained after multiplying the drift-corrected QPD displacement traces (in Figure 2b) by the respective calibrated optical trap stiffness (kx, ky, kz). We calculate the difference between force measured at time t1 and t0 (ΔpN in Figure 4b), and then we divide by Aaxon, to obtain the tension released in terms of pN/μm2.
By repeating the same protocol on different neurons in the sample, we can start sessions of experiments on several cultures treated with chemical factors or plated on different supports, and finally compare the average value obtained in the distinct experimental conditions. In Figure 5, we show the release of tension after axonal lesion is dampened by focal adhesions on the substrate, thus a higher tension release value means an axon less adhered to the substrate. Because we induce a partial, and not complete, lesion of the axon, we investigated the dependence of the measured tension release on the total energy delivered, and on the neurite contact area between the lesion site and the trapped bead. We sought to destroy more cytoskeletal elements by delivering a higher number of light pulses, and consequently induce a higher release of tension. Otherwise, with an increased neurite contact area, we expected to measure a lower amount of tension release. In Figure 5, we show that the dependency on the two above-mentioned parameters is not clear. Therefore, we deduced that the induced partial lesion (with the previously calibrated low energy per pulse; see protocol step 4.5), is related to the dimension of the ablation spot8, which does not vary when using the same microscope objective and the same energy per pulse at the sample. Moreover, the fact that the release of tension is not correlated to the contact area is not surprising because it is well known that such parameters do not represent a good estimate of the cell adhesion to the substrate, as focal adhesions occupy only 1% of the basal surface22.
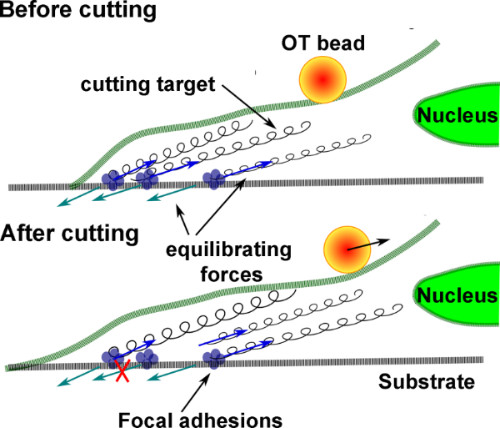
Figure 1. Graphical representation of the disrupted cytoskeleton equilibrium during laser axotomy. A cell adheres to a substrate by focal adhesions. Blue arrows specify traction forces generated by cytoskeletal elements (indicated by springs). Light-blue arrows indicate the counteracting forces generated by the rigid culture substrate. In a simplified scenario, before lesion, the cytoskeletal and substrate forces are paired and equilibrated. After laser-induced lesion of the neurite, the connections between some springs and the substrate are disrupted. Thus, the substrate is no longer counteracting the traction force of the cytoskletal element. The trapped bead, attached to membrane, tracks the direction of the released cytoskeleton forces.
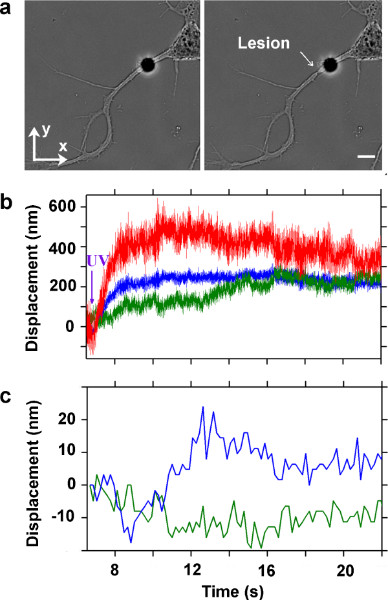
Figure 2. Interferometric tracking of a trapped bead, attached to the membrane of the axon of a hippocampal neuron during laser induced lesion. (a) Bright field images acquired during ablation of an axon. Before the lesion on the left panel. After the lesion on the right panel. A poly-D-Lysine coated bead is attached to the membrane (polystirene bead, Ø 4 μm) and held in an optical trap. Average power of the IR laser at the sample is 14 mW. White arrow indicates the lesion site. Bar is 5 μm. (b) Recorded traces by back focal plane interferometry of the bead position in the optical trap. Blue, green and red traces represent the bead position along x, y, and z axes, respectively. Sampling rate is 20 kHz. (c) Displacement of a scratch on the culture support measured by video tracking to monitor the stage drift. Blue and green traces are the x and y positions obtained by video tracking. Frame rate is 5.5 Hz.
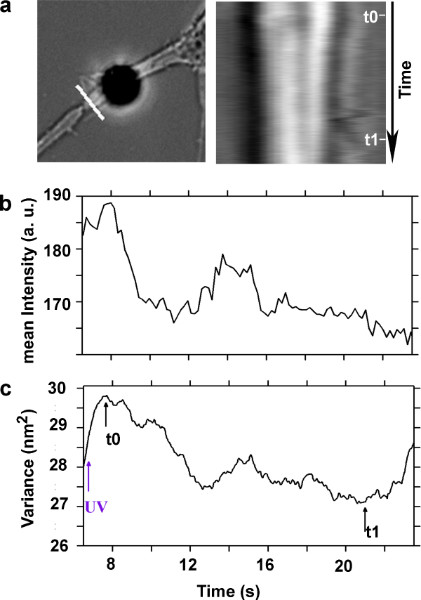
Figure 3. Analysis of the axon diameter during the tension release, and the membrane strain of the lesioned axon. (a) Bright field image of the lesioned axon, on the left panel. The white line perpendicular to the axon indicates the position where a kymograph is computed. On the right panel, kymograph of the axon diameter, upstream of the lesion site. Each row of the kymograph corresponds to 0.18 sec. (b) Sum of pixel intensities of each row of the kymograph representing an estimate of the axon diameter during the tension release. (c) Total variance of the Brownian motion of the bead attached to the axon (t0 and t1 indicate respectively the beginning and the end of tension release in the axon after dissection).
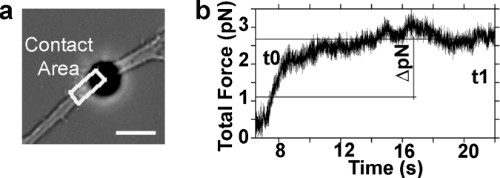
Figure 4. Quantification of the tension released after axotomy. (a) Bright field image of the lesioned axon. The white box indicates the estimate of the neurite contact area between the lesion site and the center of the trapped bead. (b) Trace of the total amplitude of the force measured after axotomy (Ftot= √(Fx2+Fy 2+Fz 2)). Fx, Fy, and Fz were calculated by Hooke’s law (F = kx), where the displacement traces are the ones shown in Figure 2b. The stiffnesses, in the three orthogonal directions, of the optical trap were calculated by the power spectrum method (kx,y = 7.9 pN/μm, kz = 2.3 pN/μm). ΔpN indicates the measured released force between the time instants t0 and t1.
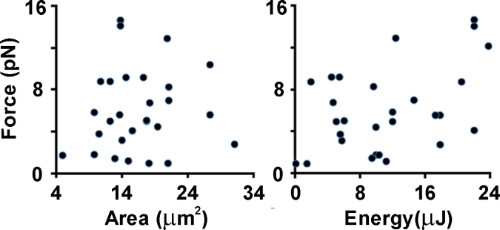
Figure 5. Dependence of measured tension release on the amount of energy delivered to the sample, and on the neurite contact area. Data from 26 experiments performed on the axons of mouse hippocamapal neurons at 3 DIV. (a) Scatter plot of tension release versus neurite contact area between lesion and trapped bead locations. (b) Scatter plot of tension release versus total amount of energy delivered to the sample neurite contact area.
We report in this work a quantitative method to compare the neurite adhesion to the culture substrate, by performing simultaneous force spectroscopy measurement during laser induced cell lesion. The measured release of tension is related to the degree of adhesion of the cell to the substrate: cells with a higher number of focal adhesions should release less tension. Measuring the release of tension in terms of piconewtons provides a physical quantity by which to evaluate the axonal adhesion to the culture support in different experimental conditions14.
Several laboratories integrated a laser dissector with an optical tweezers system, adopting distinct optical designs23. Our choice was a setup with fixed optical path and microscope stage motion. To accomplish this, we introduce a spatial light modulator in the IR laser beam path to move the trapping spot with respect to the UV laser position. Although galvanometric mirrors allow steering the laser focus position without moving the sample, they can introduce mechanical noise in the system affecting the force spectroscopy measurements. Moreover, we decided to re-position the IR laser focus in the sample, since Brownian motion analysis permits a fast re-calibration of the optical stiffness. Moving the UV laser spot position onto the sample can produce spherical aberrations affecting the quality of the UV focus spot itself, which are negligible only for small displacements of the beam from its central position. Therefore, modification of the optical properties of the laser dissector could require a de novo calibration of the delivered laser power versus damage to the entity.
By force spectroscopy measurement, we could observe that the tension release is composed of a fast phase of a few seconds, and a slow phase that could last some tens of seconds. As reported in previous work14, sometimes the slow phase could last a few minutes. For that reason, we had to correct the force measurement by video tracking a scratch on the culture support. In the future, a better approach would be to cancel stage drift with a feedback loop, which auto-corrects the microscope stage position by video or interferometric tracking of a bead attached to the cover glass. This type of configuration, already reported in the literature, requires a second laser beam centered on the attached bead, and ensures stage stabilization with sub-nanometer precision24,25.
In the future, we want to apply the developed protocol to compare the axonal adhesion to the culture support at different stages of differentiation and in different pathological conditions to provide a quantitative assay for pharmacological treatment. Moreover, the same protocol could apply to the design of implantable scaffolds, to compare the neuronal adhesion to different types of materials with distinct mechanical or chemical properties26.
The authors have nothing to disclose.
Alberto Guiggiani for developing the real time control system, Evelina Chieregatti and Hanako Tsushima for insightful discussions, Giacomo Pruzzo and Alessandro Parodi for the development of custom electronics and software, and Claudia Chiabrera and Marina Nanni for their expert advice and assistance in cell culture preparation.
REAGENTS | |||
Polymer microspheres, Ø 4 μm, COOH coated | Bangs laboratories | PC05N/6700 | |
PolyLink Protein Coupling Kit | Polyscience | 19539 | |
EQUIPMENT | |||
IR laser | IPG Laser GmbH | YLM-5-SC-LP | ytterbium continuous wave (CW) fiber laser operating at 1064 nm, with linear polarization |
Spatial light modulator | Hamamatsu | LCOS-SLM 10468-07 | |
Blue-tweezers software | Optics group, University of Glasgow | Free downloadable software | http://www.physics.gla.ac.uk/Optics/projects/tweezers/slmcontrol/ |
ImageJ | NIH | Free downloadable software | http://rsbweb.nih.gov/ij/ |
QPD | Thorlabs | S5980 with C5460SPL 6041 board | Four quadrant photo-diode to measure x, y trapped probe displacement |
PD | Teem Photonics | PDA100A-EC | Photodiode to measure z trapped probe displacement |
nano-Pulse UV laser | AA-optoelctronics | PNV-001525-040 | Pulsed UVA laser, pulse length 400 ps |
Acoustic Optic Modulator | Olympus | MQ110-A3-UV, 355 nm fused silica | |
Upright microscope | Andor | BX51 | Equipped with a 60X, 0.9 NA, water dipping objective |
CCD | Warner Instruments | V887ECSUVB EMCCD | |
Peltier device | Physic Instruments | QE1 resistive heating with TC-344B dual channel heater controller | |
Microscope stage: micro+piezo stage | National Instruments | Three linear stages M-126.CG1 carrying a separate 3-axis piezoelectric nano-positioning stage P-733.3DD | |
Daq | NI PCI-6229 | Acquiring the x, y, z position of the trapped probe, and sending feedback loop signals to microscope stage | |
Linux Real Time Application Interface (RTAI) machine | Real time feedback loop system, to control stage position, developed on a dedicated PC desktop |