To determine the S-phase duration and, more broadly, the duration of G1 and G2 + M (protocol step 1.1), S. cerevisiae W303 wild-type cells (WT, Table 1) were grown asynchronously in SC medium for 7 h. Every hour, the cell concentration was monitored to determine the doubling time (Figure 2B). In these growth conditions, the calculated doubling time was 120 min ± 13 min at 25 ˚C (Table 2). When the cells were in the exponential phase (2 × 10⁶-5 × 10⁶ cells/mL), an aliquot of cells was pulse-labeled with EdU (10 µM) for 5 min to single out the cells in the S phase and determine the percentage of cells that were in the G1, S, and G2 + M phases. Three populations of cells were observed in a bivariate EdU-PI cytometer analysis (Figure 1B). The discrimination between the EdU-negative and EdU-positive populations was made using a control experiment in which the cells were not pulse-labeled with EdU but the Click reaction was carried out (Figure 1C). The two EdU-negative populations in the bottom-left and the bottom-right areas that differed in PI intensity two-fold corresponded to G1 and G2 + M, respectively (Figure 1B,C). Therefore, the upper population (with an intensity >1× 10⁴-2 × 10⁴) corresponded to the EdU-positive cells that were in the S phase at the time of the pulse (Figure 1B). Hence, 27% ± 5% of the cell population was in the G1 phase, 29% ± 3% was in the S phase, and 44% ± 2% was in G2 + M. As the doubling time was 120 min ± 13 min in these conditions, we extrapolated that the G1, S, and G2 + M phases lasted 32 min ± 4 min, 35 min ± 6 min, and 53 min ± 7 min, respectively, at 25 °C (Table 2 and Table 3).
Next, we aimed to validate this method and show that it is sensitive enough to identify mutants with DNA replication defects that have been overlooked so far. We reasoned that tunable loss-of-function alleles of the factors involved in DNA replication would be ideal validation controls. Hence, we used a yeast strain containing a temperature-sensitive cdc6-1 mutant (Table 1)11. Cdc6 is an essential licensing factor that is expressed in late M and G1 to assemble prereplication complexes (preRC) on ORC-bound chromosome sites that may later be used as replication origins. Therefore, at a permissive temperature, its S-phase duration should be the same as that of the WT, while at a restrictive temperature, no DNA replication should occur as no origin is licensed12. However, at a semi-permissive temperature, where fewer origins are licensed but there are enough to confer cell viability (our unpublished data; Barba Tena et al., in preparation), we anticipated different durations for each phase. As expected, based on drop tests, the cdc6-1 cells grew the same as WT cells at a permissive temperature (i.e., 25 °C, Figure 2A), displaying the same doubling time (Figure 2B and Table 2), but were dead at or above 34 °C (Figure 2A). Of interest, at a semi-permissive temperature (i.e., 28 ˚C), cdc6-1 was viable (28 ˚C, Figure 2A). However, the doubling time was longer than for WT (Figure 2B and Table 2), and the duration of each phase was different. Indeed, in cdc6-1, G1 was slightly shorter (12 min ± 1 min vs. 16 min ± 2 min), while the S phase was slightly extended (34 min ± 4 min vs. 29 min ± 5 min), and the G2 + M phase was significantly longer (77 min ± 4 min vs. 45 min ± 3 min) compared to WT (Figure 2C,D and Table 3). The S phase was, surprisingly, not extended very much, but the mean intensity of the EdU signal was decreased by 25% (Figure 2C,D), which is consistent with an S phase initiated from fewer origins. Moreover, while the EdU-positive WT cells were homogenously distributed between the early (S1) and late S (S2) phases (Figure 2C, Supplemental Figure S1A, early [S1] and late S [S2] phases delimited with a vertical dashed line in the upper gate), 65% of the EdU-positive cdc6-1 cells accumulated in the late S phase (Figure 2D, Supplemental Figure S1B). There was even no clear distinction between the S and G2 + M populations (Figure 2D), suggesting that the cells struggled to complete the S phase before entering G2 phase. Therefore, this method is suitable and sensitive to identify mutants with defects in the S phase (duration and/or distribution) and in cell cycle phase duration.
A complementary method was devised to determine when cells start and finish their DNA replication and estimate the S-phase duration using synchronized cells (protocol step 1.2). To this end, using α-factor with synchronized cells in G1, cells were released in SC medium and collected every 5 min. The duration of the S phase may be about 25 min based on the time when the DNA content changed from 1C to 2C on the Sytox Green flow cytometer profile (Figure 3A). However, this estimation depends on when a significant cell fraction of the population has incorporated enough Sytox Green to be seen in the FACS profile. The early and late replication events cannot be detected with this method. To define accurately when the S phase starts and finishes and how long it lasts, S-phase cells were singled out from an aliquot of cells upon pulse-labeling with EdU (10 µM) for 5 min every 5 min after the G1 release. As expected, within the first 10 min after the release, all the cells were in the bottom-left area (i.e., in G1, Figure 3B, Supplemental Figure S2). Fifteen minutes after the release, a fraction of EdU-positive cells was already detected (compare the first two rows in Supplemental Figure S2 and Supplemental Figure S3, EdU-treated and EdU-free cells, respectively), indicating that the S phase had started (Figure 3C). The progression through the S phase was seen by the cell cloud first moving upward and then rightward in the bivariate PI-EdU graph (Figure 3D-F). Finally, 35 min from the release, a fraction of cells was EdU-negative but with twice the amount of DNA, indicating that those cells had completed the S phase and were in the G2 + M phase (Figure 3G). Thus, the S phase lasts 20 min in these conditions. Of note, despite the high synchrony observed with the overlay of DNA content detected with Sytox Green, suggesting that the S phase was over in the whole population 40 min after the release, the bivariate analyses showed that some cells finished the S phase 60 min after the release and that the S phase was complete for the whole population 65 min after the release (Figure 3H,I and Supplemental Figure S2).
Additionally, the S phase and DNA synthesis can be monitored by microscopy. From each activated replication origin, DNA synthesis is carried out by two tethered replisomes, forming a nuclear replication focus that may be followed by microscopy by imaging a tagged version of a replication factor and/or operators array and their corresponding repressor fused to a fluorescent protein2,13. Alternatively, DNA synthesis can be detected by microscopy using thymidine analogues14,15. We used EdU to monitor the subnuclear DNA regions that undergo DNA synthesis. To this end, we pulse-labeled asynchronous WT and cdc6-1 cells with EdU (10 µM) for 3 min at 28 °C and imaged them after the Click reaction. We were expecting to detect variations in the EdU signal intensities depending on the DNA synthesis rate and on the cell progression in the cell cycle during the 3 min EdU pulse (i.e., cells spending the whole 3 min in the S phase will display a stronger signal than those entering or exiting S phase during the pulse). Accordingly, WT S-phase cells displayed an EdU signal in their nucleus that varied in intensity (Figure 4A). The S-phase duration can be readily extrapolated from this analysis. Indeed, it was determined from two biological replicates (at least 150 cells were counted), that 34% ± 3% and 38% ± 3% of WT and cdc6-1 cells were EdU positive, respectively. As in these growth conditions, the doubling time was 90 min and 123 min for the WT and cdc6-1 cells, respectively (Table 2), we extrapolated that the S phase lasted 31 min and 47 min, respectively. The former result is in line with that obtained from our FACS analyses (Table 3), indicating that the detection of EdU-positive cells by microscopy allows the determination of the S-phase duration. Of note, the latter is higher than the S-phase duration extrapolated from our FACS analyses because there was no clear distinction between the S and G2 + M populations (Figure 2D). The EdU foci were readily observed in the WT cells (Figure 4B) but were dimmer and fewer in the cdc6-1 cells (Figure 4C). To rule out the possibility that the EdU signal intensity difference between the WT and cdc6-1 cells depended on the step of the S phase, the intensity was quantified from synchronized cells. As expected, the mean EdU signal intensity was three-fold lower in the cdc6-1 cells (Figure 4D), consistent with DNA replication initiated from fewer replication origins. The EdU signal was restricted to the nucleus, colocalizing with a strong DAPI signal, and organized in globular patterns, consistent with the organization of DNA replication in nuclear regions or replication factories. Importantly, EdU was only detected in unbudded or small-budded cells and never present in cells with large buds, indicating that the WT yeast cells had finished replication by the time they entered mitosis. This method is, therefore, sensitive for visualizing DNA replication at a high spatial resolution, as well as for detecting and quantifying mild DNA replication defects.
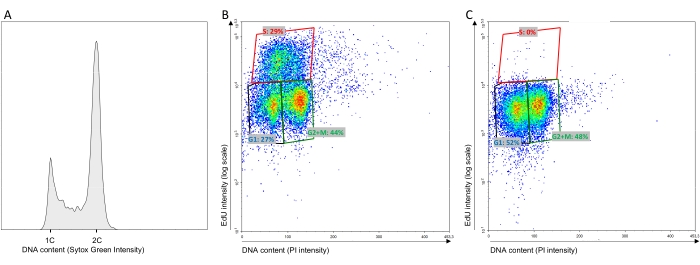
Figure 1: Representative FACS analyses. (A) Representative Sytox Green FACS analyses for WT cells grown at 25 °C. (B,C) Representative EdU-PI bivariate FACS analyses for WT cells grown at 25 °C and pulse-labeled for 5 min with EdU (10 µM) or 1 µL of DMSO. The polygons were the same in both analyses. C was used to delineate the EdU-negative from the EdU-positive cells (generally, the limit is set at an intensity >1× 10⁴-2 × 10⁴). The top polygon gate delineated the EdU-positive cells (S-phase fraction). Please click here to view a larger version of this figure.
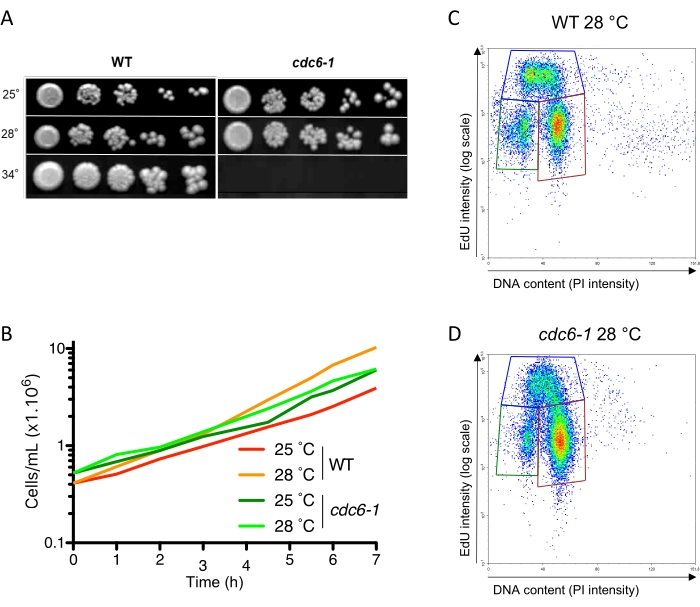
Figure 2: Fraction of cells in the G1, S, and G2 + M cell cycle phases in asynchronous cell populations. (A) WT and cdc6-1 strains were spotted at serial five-fold dilutions on rich medium and grown either at 25 °C, 28 °C, or 34 °C. (B) Population doubling time. Asynchronous WT and cdc6-1 cells were grown at 25 °C or 28 °C, and the cell concentration was measured every hour for 7 h. (C,D) EdU-PI bivariate FACS analysis of WT and cdc6-1 cells grown at 28 °C and pulse-labeled for 5 min with EdU (10 µM). Multiplying the population doubling time by the S-phase fraction provides the S-phase duration. The mean intensities of the EdU-positive and EdU-negative cells were calculated as the mean of the intensity of each value in the corresponding polygon. The mean intensities of the WT and cdc6-1 EdU-negative cells (5,077 and 4,454, respectively) were normalized to 1. The mean intensities of the WT and cdc6-1 EdU-positive cells (52,604 and 36,141, respectively) were divided by the normalization factor used for each strain. The obtained values were 10.4 and 8.1, respectively (i.e., a 25% decrease, as mentioned in the text). Abbreviations: WT = wild-type; EdU = 5-ethynyl-2'-deoxyuridine; FACS = fluorescence-activated cell sorting; PI = propidium iodide. Please click here to view a larger version of this figure.
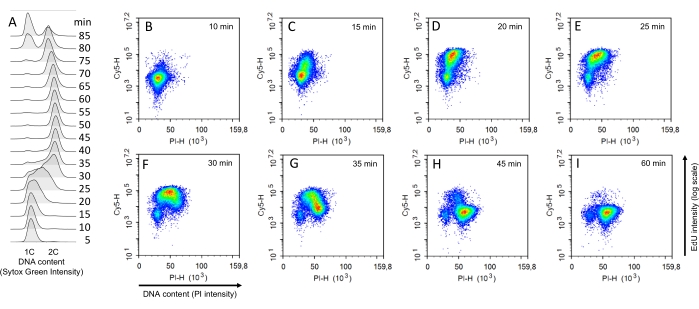
Figure 3: Determination of the S-phase duration on synchronized cells. (A) Time course analysis of the DNA content of WT cells after α-factor release at 28 °C. The indicated time takes into account the duration of the EdU pulse (5 min). (B–I) EdU-PI bivariate FACS analyses for synchronized WT cells pulse-labeled for 5 min with EdU (10 µM) and collected at the indicated times after the release from G1 arrest. Abbreviations: WT = wild-type; EdU = 5-ethynyl-2'-deoxyuridine; FACS = fluorescence-activated cell sorting; PI = propidium iodide. Please click here to view a larger version of this figure.
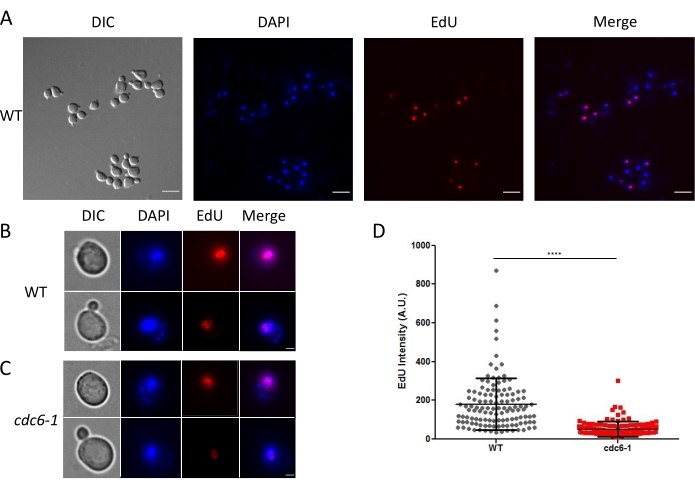
Figure 4: EdU detection and quantification by microscopy. Asynchronous WT and cdc6-1 strains were grown for 2 h at 28 °C, and then pulse-labeled for 3 min with EdU (10 µM) and imaged by wide-field microscopy using adequate excitation/emission filters. (A) Representative images from wide-field microscopy for WT and (B,C) individual cells for WT and cdc6-1 visualized by DIC and stained with DAPI or for EdU, as indicated. The scale bars in (A) and (B,C) are 10 µm and 2 µm, respectively. (D) EdU intensity measurements on synchronous WT and cdc6-1 cells grown at 28 ˚C 30 min after the release from G1 arrest. The graph represents the pooling of three biological replicates (at least 50 cells were counted in each biological replicate). Mean ± SD are displayed on the graph. An unpaired two-tailed t-test between WT and cdc6-1 cells is indicated by **** (p < 0.0001). Abbreviations: WT = wild-type; EdU = 5-ethynyl-2'-deoxyuridine; DIC = differential interference contrast; DAPI = 4',6-diamidino-2-phenylindole; A.U. = arbitrary units. Please click here to view a larger version of this figure.
| Name | Genotype | Figures and tables | ||
| WT (E3087): | MATa, ade2-1, trp1-1, can1-100, leu2-3,112, his3-11,15, RAD5, ura3::URA3/GPD-TK(5x), AUR1c::ADH-hENT1 | Fig.1, Fig.2A,B,C, Fig3, Fig.4A,B,D, Supp Fig.1,2,3 Tables2,3 | ||
| cdc6-1 (E5956): | MATa, ade2-1, trp1-1, can1-100, leu2-3,112, his3-11,15, cdc6-1, RAD5, ura3::URA3/GPD-TK(5x), AUR1c::ADH-hENT1 | Fig.2A,B,D, Fig.4 C,D, Supp Fig.1, Tables2,3 | ||
| TK+ (E1000): | MATa, ade2-1, trp1-1, can1-100, leu2-3,112, his3-11,15, RAD5, ura3::URA3/GPD-TK(7x) | Supp Fig.4 | ||
| TK+ hENT+ (E2031): | MATa, ade2-1, trp1-1, can1-100, leu2-3,112, his3-11,15, RAD5, ura3::URA3/GPD-TK(7x), AUR1c::ADH-hENT1 | Supp Fig.4 | ||
| hENT+ (E2031): | MATa, ade2-1, trp1-1, can1-100, leu2-3,112, his3-11,15, RAD5, AUR1c::ADH-hENT1, RAD52-GFP, URA3::mCherry-TUB1 | Supp Fig.4 | ||
| cdc6-1 TK+ hENT+ (E3968): | MATa, ade2-1, trp1-1, can1-100, leu2-3,112, his3-11,15, cdc6-1, RAD5, ura3::URA3/GPD-TK(7x), AUR1c::ADH-hENT1 | Supp Fig.4 | ||
| W303-1A (E001): | MATa, ade2-1, trp1-1, can1-100, leu2-3,112, his3-11,15, RAD5, ura3-1 | Supp Fig.4 | ||
Table 1: List of the strains used in this study.
| WT | cdc6-1 | |||
| 25 ˚C | 28 ˚C | 25 ˚C | 28 ˚C | |
| Doubling time (min) | 120 | 90 | 118 | 123 |
| SD | ± 13 min | ± 3 min | ± 10 min | ± 6 min |
Table 2: Mean doubling times of WT and cdc6-1 strains grown at 25 °C and 28 °C. The doubling times were calculated from three biological replicates (four technical replicates for each biological replicate) using the following formula: Δt × ln(2)/ln(Cf/Ci), where Cf and Ci correspond to the final and initial cell concentrations, respectively, and Δt corresponds to the difference in minutes between tf and ti, when Cf and Ci were measured, respectively.
| WT | cdc6-1 | |||||||
| 25 ˚C | 28 ˚C | 25 ˚C | 28 ˚C | |||||
| Percent | Duration (min) |
Percent | Duration (min) |
Percent | Duration (min) |
Percent | Duration (min) |
|
| G1 | 27 | 32 | 18 | 16 | 13 | 16 | 10 | 12 |
| S | 29 | 35 | 32 | 29 | 28 | 34 | 28 | 34 |
| G2+M | 44 | 53 | 50 | 45 | 59 | 71 | 62 | 77 |
| SD G1 | ±5 | ±4 | ±3 | ±2 | ±2 | ±1 | ±1 | ±1 |
| SD S | ±3 | ±6 | ±5 | ±5 | ±5 | ±7 | ±4 | ±4 |
| SD G2+M | ±2 | ±7 | ±4 | ±3 | ±4 | ±4 | ±6 | ±4 |
Table 3: Mean fractions of cells and duration of the G1, S, and G2 + M phases in WT and cdc6-1 cells grown at 25 °C and 28 °C. The fractions of cells were determined from three biological replicates (two technical replicates for each biological replicate). The differences in G1, S, and G2 + M duration between the WT and cdc6-1 cells grown at 28 ˚C were statistically significant (unpaired two-tailed t-test, p < 0.1).
Supplemental Figure S1: Fraction of cells in the early and late S phases in WT and cdc6-1 cells grown at 28 °C. Two identical polygons named S1 and S2 for the early and late S phases, respectively, were drawn in the fraction of EdU-positive cells to split it into two halves on the EdU-PI bivariate FACS analyses for (A) WT cells grown at 28 °C and (B) cdc6-1 cells grown at 28 °C. Please click here to download this File.
Supplemental Figure S2: Cell cycle progression of EdU pulse-labeled cells after release from G1 arrest visualized by EdU-PI bivariate FACS. An aliquot of cells was pulse-labeled for 5 min with 10 µM EdU every 5 min after release from α-factor arrest at 28 °C and until 80 min, as indicated. Abbreviations: EdU = 5-ethynyl-2'-deoxyuridine; FACS = fluorescence-activated cell sorting; PI = propidium iodide. Please click here to download this File.
Supplemental Figure S3: Cell cycle progression of DMSO-treated cells after release from G1 arrest visualized by EdU-PI bivariate FACS. This is the same as Supplemental Figure 2, but the cells were incubated for 5 min with 1 µL DMSO (dimethyl sulfoxide). Please click here to download this File.
Supplemental Figure S4: BrdU and EdU toxicity in TK hENT1 yeast cells. Cells of the indicated genotype were spotted in five-fold serial dilutions on YPD plates containing increasing concentrations of BrdU or EdU and grown for 40 h at 30 °C. Abbreviations: DMSO = dimethyl sulfoxide; BrdU = bromodeoxyuridine; Edu = 5-ethynyl-2'-deoxyuridine; TK = thymidine kinase; hENT1 = human equilibrative nucleoside transporter. Please click here to download this File.
