This protocol describes how to reconstruct mitochondrial cristae to achieve 3D imaging with high accuracy, high resolution, and high throughput.
Understanding the dynamic features of the cell organelle ultrastructure, which is not only rich in unknown information but also sophisticated from a three-dimensional (3D) perspective, is critical for mechanistic studies. Electron microscopy (EM) offers good imaging depth and allows for the reconstruction of high-resolution image stacks to investigate the ultrastructural morphology of cellular organelles even at the nanometer scale; therefore, 3D reconstruction is gaining importance due to its incomparable advantages. Scanning electron microscopy (SEM) provides a high-throughput image acquisition technology that allows for reconstructing large structures in 3D from the same region of interest in consecutive slices. Therefore, the application of SEM in large-scale 3D reconstruction to restore the true 3D ultrastructure of organelles is becoming increasingly common. In this protocol, we suggest a combination of serial ultrathin section and 3D reconstruction techniques to study mitochondrial cristae in pancreatic cancer cells. The details of how these techniques are performed are described in this protocol in a step-by-step manner, including the osmium-thiocarbohydrazide-osmium (OTO) method, the serial ultrathin section imaging, and the visualization display.
Mitochondria are one of the most important organelles in the cell. They serve as the central hub of cellular bioenergetics and metabolism1,2 and play a critical role in cancer3. Pancreatic cancer (PC) is one of the most difficult cancers4 to treat due to its rapid spread and high mortality rate. Mitochondrial dysfunction, which is mainly caused by changes in the mitochondrial morphology3,5,6,7, has been linked to the disease mechanisms underlying PC8. Mitochondria are also highly dynamic, which is reflected by the frequent and dynamic changes in their network connectivity and cristae structure9. The reshaping of the cristae structure can directly impact the mitochondrial function and cellular state10,11, which are significantly altered during tumor cell growth, metastasis, and tumor microenvironment changes12,13.
In recent years, scientists have studied this organelle using EM observation14,15,16,17; for example, researchers have analyzed the mitochondrial dynamics using 3D reconstruction techniques6,7,18,19. The general concept and method for the 3D reconstruction of electron microscopy images were formally established as early as 196820 and involved combining electron microscopy, electron diffraction, and computer image processing to reconstruct the T4 phage tail. Up until now, electron microscopy 3D imaging technology has made significant advancements in terms of the image resolution21, degree of automation22, and processing volume23 and has been used on an increasingly broad scale in biological research, from the tissue level to the organelle ultrastructure level at the nanometer scale24. In recent years, electron microscopy 3D imaging has also become a promising technology for a wide range of applications25,26,27.
The growing attention on mitochondrial cristae particularly illustrates the essential requirements for ultrastructural volume imaging. Transmission electron microscopy (TEM) has been used to visualize samples collected on a copper grid (400 mesh)28, with the electron beam passing through the section. However, due to the limited range of the copper grid, it is impossible to fully image continuous slices of the same sample29. This complicates the study of target structures during TEM imaging. Additionally, TEM relies on time-consuming and error-prone manual tasks, including cutting and collecting multiple slices and imaging them sequentially21, so it is not adapted for ultrastructural reconstructions of large-volume samples23. At present, the high-resolution reconstruction of large-volume sample imaging is achieved through the use of specialized equipment, such as the TEM camera array (TEMCA)30 or two second-generation TEMCA systems (TEMCA2)31, which enable automated high-throughput imaging in a short time. However, this type of imaging does not have the advantage of being easy to obtain and universal due to the requirement for customized equipment.
Compared with TEM, the method for automatically generating thousands of serial volumetric images for large areas based on SEM32,33 enhances the efficiency and reliability of serial imaging and delivers higher z-resolutions34. For example, serial block-face scanning electron microscopy (SBF-SEM) and focused ion beam scanning electron microscopy (FIB-SEM) have both made it possible to achieve the 3D reconstruction of ultrastructure with high speed, efficiency, and resolution35,36. However, it is inevitable that the block surface is mechanically shaved off by the diamond knife of the SBF-SEM or by milling with the focused ion beam of FIB-SEM33,37. Due to the destructiveness of the two methods to the samples, it is not possible to reconstruct the same target structure again for further analysis38,39,40. In addition, few studies have attempted to reconstruct the 3D organelle ultrastructure of cancer cells using EM to observe pathological changes12. For these reasons, in order to further elucidate the pathological mechanisms of cancer cells, such as pancreatic cancer cells, we propose a novel technology for the 3D reconstruction of serial section images using an ultramicrotome and a field emission scanning electron microscope (FE-SEM) to analyze the mitochondrial ultrastructure at the cristae level; with this technology, high-resolution data can be acquired using an efficient and accessible method. The serial ultrathin sections made using an ultramicrotome can be semi-permanently stored in a grid case and reimaged multiple times, even after several years41. FE-SEM is highly valued as a tool in various research fields due to its ability to provide high-resolution imaging, high magnification, and versatility42. In an attempt to display the fine structure of organelles in 3D, the technique for producing serial 2D image stacks with useful resolution using back-scattered electrons produced by FE-SEM43,44 can also be used to achieve high-throughput and multi-scale imaging of target regions or their associated structures without special equipment45. The generation of charge artifacts directly affects the quality of the acquired images, so it is particularly important to keep the dwell time short.
Thus, the present study elaborates on the experimental procedures employed in this SEM technique to reconstruct the 3D structure of mitochondrial cristae46. Specifically, we show the process developed to achieve the semi-automatic segmentation of mitochondrial regions and digitize the 3D reconstruction using Amira software, which also involves making slice samples using the conventional OTO specimen preparation method44,47, completing the section collection using ultramicrotome slicing, and acquiring sequential 2D data by FE-SEM.
1. Material preparation
2. Image acquisition and three-dimensional reconstruction
3. Quantification
During cell culture (Figure 1A), we first divided the pancreatic cancer cells into a control group cultured with complete culture medium, a (1S,3R)-RSL348 (RSL3, a ferroptosis activator, 100 nM) group, and an RSL3 (100 nM) plus ferrostatin-149 (Fer-1, a ferroptosis inhibitor, 100 nM) group. Through the above experimental steps, the scanning electron microscope acquired 38 (Supplementary Figure 1), 43 (Supplementary Figure 2), and 44 (Supplementary Figure 3) sequential images for the control group, RSL3 group, and inhibitor group (RSL3 + Fer-1 group), respectively. The images of 1,280 x 960 pixels were captured at 8,000-fold magnification (with a resolution of 12.40 nm/pixel). Both wrinkles and pollution in the cell area were not observed above the sections. The electron microscope pictures could clearly distinguish the organelles, such as the mitochondria and endoplasmic reticulum, in the cells (Figure 1E).
The observation of the 2D images by FE-SEM showed that, in the control group of cancer cells (Figure 5A), the mitochondria were distributed throughout the cytoplasm, and most of them were spherical or oval and evenly plump. Additionally, the relatively regular, elongated cristae architecture was clearly visible. Conversely, in the RSL3 group (Figure 5D), the majority of the mitochondria exhibited a shrinking morphology, an increase in the membrane density, and a comparatively vague cristae structure. Closer inspection of the SEM pictures (Figure 5E) revealed that not all the mitochondrial cristae degenerated or disappeared, as a relatively small number of cristae remained intact. Compared with the RSL3 group, in the inhibitor group, most of the mitochondria maintained the integral structure of mitochondrial cristae, and only a minority of the mitochondrial cristae structures were not apparent (Figure 5G).
While 2D information shows differences in mitochondrial morphology, it can sometimes result in a biased understanding of the detailed and real 3D structure50,51. The cristae structures of the control group under the 3D condition (Figure 5C) were consistent with the 2D images, but they were different for the RSL3 group. For this group, the presence of complete mitochondrial cristae could also be observed in the 2D images (Figure 5E), but the mitochondria under 3D (Figure 5F) were irregular and generally vacuolated in the middle. The inhibitor group (Figure 5I) showed diverse cristae shapes, with only some mitochondrial cristae exhibiting localized collapse. Thus, from the results of the RSL3 group, it can be seen that only using 2D analysis may lead to a one-sided understanding of the results. The results of 2D images are biased compared to the results presented when stacking a set of images for 3D display, so it is not possible to generalize results produced only through 2D information. To more objectively demonstrate the effects of RSL3 on mitochondria, 3D reconstruction data were used to quantify and measure mitochondrial alterations52. Compared with the control group, the length and volume of the 3D mitochondria in the RSL3 group were significantly decreased, but the quantification results of the inhibitor group fell between the results of the other two groups (Figure 5J,K). These quantitative data suggest that RSL3 produces smaller and degraded mitochondria, and the addition of inhibitors reduces this effect.
As shown in Figure 6B and Figure 6C, it was determined that the ferroptosis inducer RSL3 caused mitochondrial dysfunction and affected the cellular metabolism by altering the mitochondrial morphology53,54 and eliciting ferroptosis, which may represent a ubiquitous form of dynamic cell death in cancer therapy induced by RSL355.
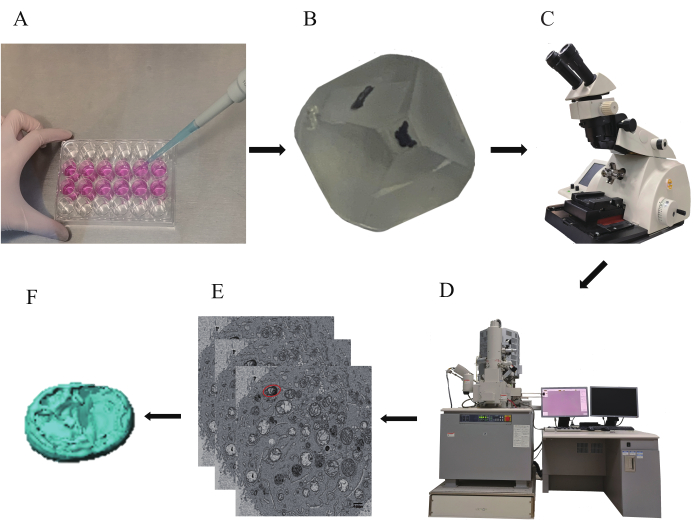
Figure 1: General workflow for the 3D reconstruction of pancreatic cancer cell mitochondria. A general workflow for the 3D reconstruction experiments described in this protocol is demonstrated. (A) Culture of pancreatic cancer cells. (B) Preparation of the resin block. (C) Collection of serial sections using an ultramicrotome. (D) Acquisition of 2D images using a field emission scanning electron microscope. (E) Positioning of the targeted mitochondria in the sequential SEM images. (F) Analysis of the mitochondria in 3D. Please click here to view a larger version of this figure.
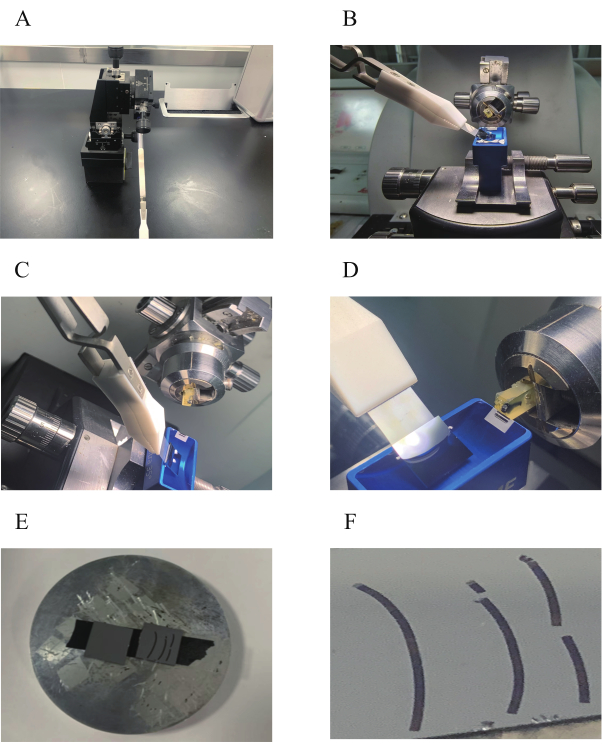
Figure 2: A device for the slice strips mounting of continuous slices onto a hydrophilized silicon wafer. (A) An adjustable angle manipulator with forceps for holding the wafer. (B) Frame of the wafer holder placed next to the ultramicrotome. (C) Positioning of the silicon wafer in the blue slot containing the diamond knife. (D) A close-up showing the positional relationship between the silicon wafer and the diamond knife blade. (E) A silicon wafer with slice strips attached to the sample stage of the SEM with conductive carbon glue. (F) A close-up showing the general overview of the serial slice strips. Please click here to view a larger version of this figure.
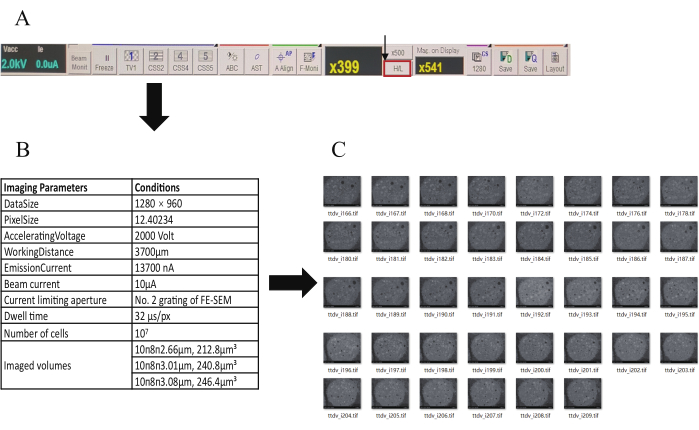
Figure 3: The process of setting the parameters and acquiring the images. (A) The menu bar of the FE-SEM (the arrow points to the H/L option). (B) Table of imaging parameters and conditions. (C) Overview of consecutive 2D images in three groups. Please click here to view a larger version of this figure.
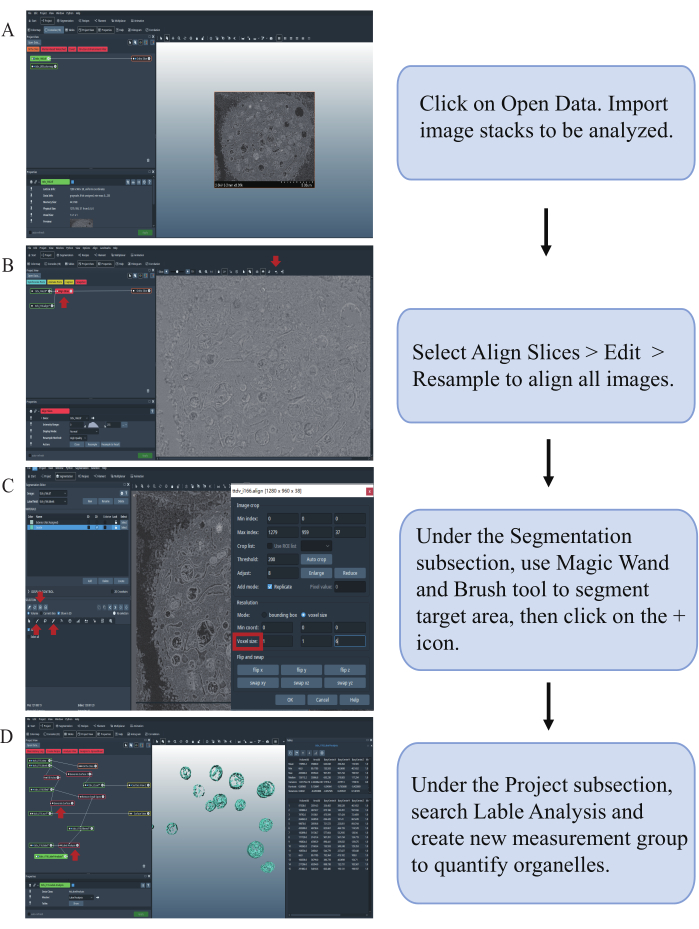
Figure 4: A step-by-step guide to visualize mitochondria in 3D using Amira. (A) Importing images from a specific folder. (B) Aligning image stacks according to the target structure. (C) Segmenting and adding the region of interest. (D) Reconstructing the 3D structure and adding the quantification data. Please click here to view a larger version of this figure.
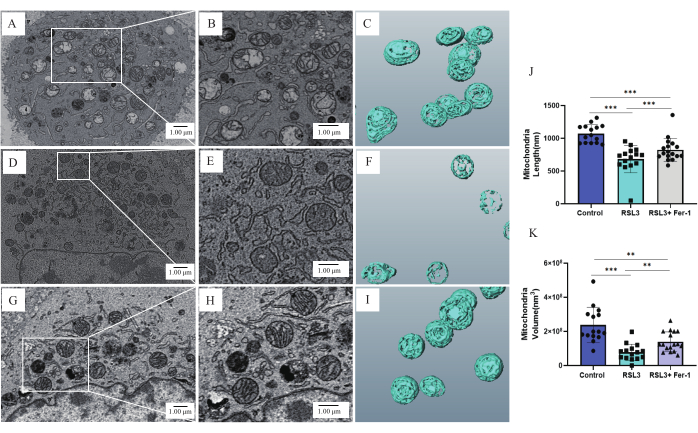
Figure 5: The 2D and 3D morphology of mitochondria in each group. The 2D cancer cell morphology of the control group at (A) 8,000-fold magnification and (B) 15,000-fold magnification. (C) A 3D representation of the mitochondrial morphology of the control group. The 2D cancer cell morphology of the RSL3 group at (D) 8,000-fold magnification and (E) 15,000-fold magnification. (F) A 3D representation of the mitochondrial morphology of the RSL3 group. The 2D cancer cell morphology of the RSL3 + Fer-1 (inhibitor) group at (G) 8,000-fold magnification and (H) 15,000-fold magnification. (I) A 3D representation of the mitochondrial morphology of the RSL3 + Fer-1 (inhibitor) group. The quantitative data for the (J) length and (K) average volume of the mitochondria in each group. Significant differences are indicated with asterisksand were calculated using the Student's t-test (vs. control group, *p≤ 0.05, **p≤ 0.01, ***p≤ 0.001.) Please click here to view a larger version of this figure.
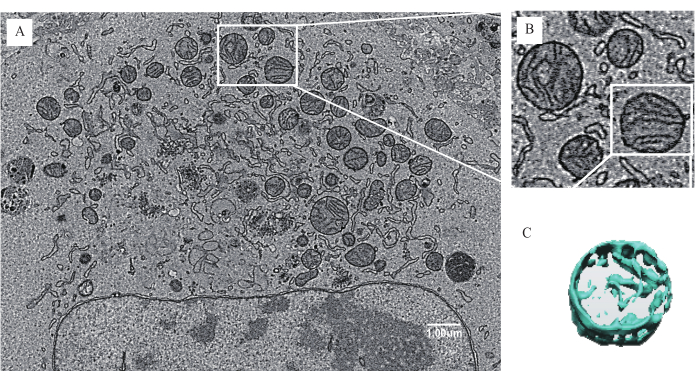
Figure 6: Differences in the mitochondrial morphology of cancer cells at 2D and 3D levels. (A) The 2D cancer cell morphology of the RSL3 group at 8,000-fold magnification. (B) The 2D mitochondrial morphology at a higher magnification. (C) A 3D representation of specific mitochondria. Please click here to view a larger version of this figure.
Imaging Parameters | Conditions |
DataSize | 1280 × 960 |
PixelSize | 12.40234 |
AcceleratingVoltage | 2000 Volt |
WorkingDistance | 3700μm |
EmissionCurrent | 13700 nA |
Beam current | 10μA |
Current limiting aperture | No. 2 grating of FE-SEM |
Dwell time | 32 μs/px |
Number of cells | 107 |
Imaged volumes | 10×8×2.66μm, 212.8μm³ |
10×8×3.01μm, 240.8μm³ | |
10×8×3.08μm, 246.4μm³ |
Table 1: Summary of the recording conditions and the dataset parameters for the image acquisition.
Supplementary Figure 1: Overview of images of 38 cancer cell microsections from the control group. The image number of each microsection is arranged from the top to the bottom. Please click here to download this File.
Supplementary Figure 2: Overview of images of 43 cancer cell microsections from the RSL3 group. The image number of each microsection is arranged from the top to the bottom. Please click here to download this File.
Supplementary Figure 3: Overview of images of 44 cancer cell microsections from the RSL3 + Fer-1 (inhibitor) group. The image number of each microsection is arranged from the top to the bottom. Please click here to download this File.
The method presented here is a useful step-by-step guide for applying the 3D reconstruction technique, which involves applying electron microscopy and image processing technology to the stacking and segmentation of 2D tomographic images generated from serial ultrathin sections. This protocol highlights a limitation of 2D images that can be addressed by 3D visualization of the organelle ultrastructure, which has the advantages of strong reproducibility of the structures at a high-resolution level and higher accuracy. More importantly, this 3D visualization can be applied to tumor cells to make the study of pathological mechanisms more straightforward and reliable. This technique was examined in this work for visualizing the stereoscopic structures of mitochondrial cristae by comparing three sets of serial sections under different conditions, thereby validating the RSL3-induced mitochondrial cristae membrane degradation that occurs in cancer cells56. These results provide insights into the mechanism of action of RSL3 as an anti-pancreatic cancer drug.
The acquisition of high-resolution 2D images plays an important role in the process of the 3D reconstruction57 of mitochondrial cristae, and the image quality directly affects the reconstruction results22,58. Therefore, this method also has some limitations, such as the charging artifacts generated in SEM images59, which, in turn, can lead to incorrect segmentation of the target structures. This problem can be solved by shortening the slice scanning time, equipping SEM with a focal charge compensator34,60, and using the OTO method, for which the use of TCH can make the sample more conductive to electrons by staining with additional metals61. Relying on automatic image segmentation tends to be inaccurate in terms of determining the scope of the structure, while manual segmentation is time-consuming58. Therefore, on the basis of the fast scanning advantage of SEM to realize image collection62, the semi-automated segmentation in Amira software can be used to enable efficient imaging and reconstruction; using Amira software can also make the result more accurate and precise than using FIJI and MIB63. The key step in 3D imaging is acquiring ultrathin sections. Issues such as omission, fracture, and distortion, which affect image continuity, often occur during section collection. In order to solve problems such as the loss and breakage of slices, we used hydrophilized silicon wafers as the support for the collection of the slice strips.
Although SBF-SEM and FIB-SEM could reduce the deformation of or defects in the sections, these techniques have a slow imaging speed, require expensive instruments, and are incapable of reimaging the structure of interest64,65,66. FIB-SEM lacks system stability during imaging, while SBF-SEM is hindered by complicated sample preparation steps and a tedious workflow34. Recently, stimulated emission depletion (STED) microscopic imaging has been gradually applied to the study of mitochondrial structure. This method monitors 3D real-time images of mitochondrial cristae in live cells through the construction of probes for mitochondrial labeling67. Fluorescent dye labeling can reveal the change processes in cristaeduring mitochondrial fusion and fission68. However, live cells have limited tolerance for intense light, so it is difficult to use this technique in long-term STED imaging68. In addition, STED is restricted by its resolution, imaging depth, and pixel number69.
Compared with other techniques, the use of continuous ultrathin sections combined with 3D reconstruction technology to observe organelle ultrastructure from a wide field of view not only allows for high-throughput imaging in a short period of time but also enables the examination of high-resolution images of target structures at discrete times21, thereby improving the imaging rate and reconstruction flexibility. Moreover, organelle morphological changes and spatial connections with other organelles can be further examined. These aspects can be quantified, and the mechanisms of change can be more accurately revealed by reconstructing adjacent organelles to display their positional relationships70,71. This technology of 3D reconstruction and serial-section imaging using Amira58 reveals the correlation between diseases and organelle ultrastructural changes on the nanoscale72, has been widely used in medicine, biology, and other fields, and paves the way for the development of effective new therapeutics73,74.
The authors have nothing to disclose.
This research was supported by Natural Science Foundation of Zhejiang Province grants (Z23H290001, LY19H280001); National Natural Science Foundation of China grants (82274364, 81673607, and 81774011); as well as the Public Welfare Research Project of Huzhou Science and Technology Grant (2021GY49, 2018GZ24). We appreciate the great help, technical support, and experimental support from the Public Platform of Medical Research Center, Academy of Chinese Medical Science, Zhejiang Chinese Medical University.
(1S,3R)-RSL3 | MCE | HY-100218A | |
Acetone | SIGMA | 179124 | |
Amira | Visage Imaging | ||
Aspartic acid | MCE | HY-42068 | |
Dulbecco's modified Eagle’s medium | Gibco | 11995115 | |
Ethanol | Merck | 100983 | |
Ferrostatin-1 | MCE | HY-100579 | |
Fetal bovine serum | Gibco | 10437010 | |
Field emission scanning electron microscope | HITACHI | SU8010 | |
Glutaraldehyde | Alfa Aesar | A10500.22 | |
Lead nitrate | SANTA CRUZ | sc-211724 | |
Osmium Tetroxide | SANTA CRUZ | sc-206008B | |
Panc02 | European Collection of Authenticated Cell Cultures | 98102213 | |
Penicillin-streptomycin | Biosharp | BL505A | |
Phosphate Buffered Saline | Biosharp | BL302A | |
Pon 812 Epoxy resin | SPI CHEM | GS02660 | |
Potassium ferrocyanide | Macklin | P816416 | |
Thiocarbohydrazide | Merck | 223220 | |
Ultramicrotome | LEICA | EMUC7 | |
Uranyl Acetate | RHAWN | R032929 | 2020.2 |