Growth phenotypes contribute critically to yeast fitness. Natural selection can efficiently distinguish between lineages with growth rates differing by the inverse of the effective population size, which can exceed 108 individuals1. Furthermore, variability of growth rates among individuals within a population is an evolutionarily relevant parameter, as it can serve as the basis for survival strategies such as bet hedging2,3,4,5,6. Therefore, assays that allow for highly accurate measurements of growth phenotypes and their distributions are pivotal for the study of microorganisms. The microcolony growth assay described here can generate individual growth-rate measurements for ~105 microcolonies per experiment. This assay therefore provides a powerful protocol to study yeast evolutionary genetics and genomics. It lends itself particularly well to testing how variability within populations of genetically identical single cells is generated, maintained, and contributes to population fitness7,8,9,10.
The method described here (Figure 1) uses periodically captured, low-magnification brightfield images of cells growing in liquid media on a 96- or 384-well glass-bottom plate to track growth into microcolonies. The cells adhere to the lectin concanavalin A, which coats the bottom of the microscope plate, and form two-dimensional colonies. Because the microcolonies grow in a monolayer, microcolony area is highly correlated with cell number7. Therefore, accurate estimates of microcolony growth rate and lag time can be generated with custom image-analysis software that tracks the rate of change of the area of each microcolony. Furthermore, the experimental setup can monitor the abundances and even the subcellular localizations of fluorescently labeled proteins expressed in these microcolonies. Downstream processing of data from this microcolony growth assay can be achieved by custom analysis or by existing image-analysis software, such as Processing Images Easily (PIE)11, an algorithm for robust colony area recognition and high-throughput growth analysis from low-magnification, brightfield images, which is available via GitHub12.
Because growth-rate estimates derived from the microcolony-growth assay are generated from a large number of single-colony measurements, they are extremely accurate, with standard errors several orders of magnitude smaller than the estimates themselves for a reasonably sized experiment. Therefore, the power of the assay to detect growth-rate differences between different genotypes, treatments, or environmental conditions is high. The multiwell-plate format allows numerous different environment and genotype combinations to be compared in a single experiment. If strains constitutively express different fluorescent markers, they may be mixed in the same well and distinguished by subsequent image analysis, which could increase power further by allowing well-by-well data normalization.
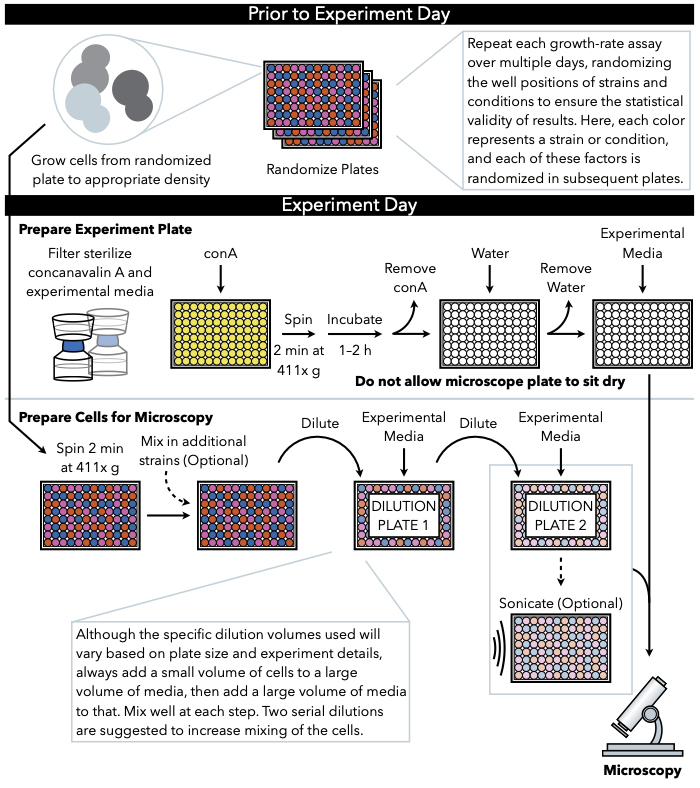
Figure 1: Schematic representation of the protocol. This protocol follows two main steps, which are the preparation of the experimental plate and the preparation of the cells to image. Randomization of plates and growth of cells should be conducted before and leading up to the experiment day. Repeated mixing of cells at each step during dilution is imperative in the steps until plating, and therefore preparing the experimental plate first is recommended so that it is ready for plating immediately upon the completion of cell dilution. Please click here to view a larger version of this figure.
The novelty of this protocol is that growth rate can be calculated for individual cells within a population by tracking their growth into microcolonies through time-lapse imaging (Figure 2A). Because microcolonies grow for many hours in a planar manner due to the presence of concanavalin A, their areas can be tracked throughout the experiment, and a linear fit to the change in the natural log of the area over time can be used to calculate growth rate for each individual colony observed 7,9,10,13. Differences in microcolony growth rate for individual isogenic cells in the same environment are clearly recorded (Figures 2A, 2B). Image-analysis software should be used to automatically track changes in microcolony size and fluorescence (Figure 2C); the colony tracking shown in Figure 2A was done using PIE11,12.
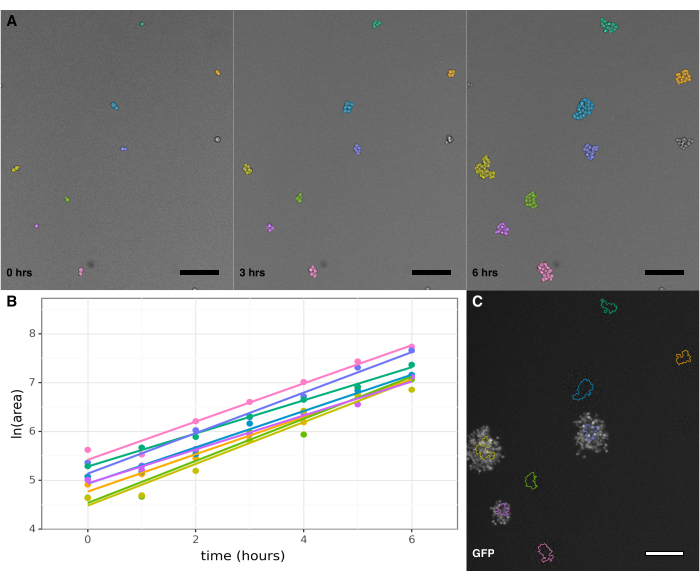
Figure 2: Quantification of growth rate and fluorescence in yeast microcolonies. (A) A portion of a single imaging field showing microcolonies growing at the start of the experiment, after 3 h, and after 6 h, showing colony tracking using the PIE colony tracking software. Colonies are visibly growing in a monolayer for the duration of the experiment. (B) Change in ln(area) over time for the tracked colonies in panel A. If sufficient timepoint data exist for a colony, its growth rate and pre-growth lag time can be calculated. (C) Image showing GFP fluorescence intensity for the colonies in panel A, taken after the growth portion of the experiment is complete, with the colony outlines from the 6-h timepoint overlaid. Here, Scw11P::GFP marks a reference strain included in every experimental well. Calculating the GFP fluorescence level of each colony allows determination of which colonies originate from the reference strain, and which from the non-reference strains in each well. Each scale bar is 50 µm. Please click here to view a larger version of this figure.
Typically, ~105 microcolony growth rates per experiment can be collected using this assay. These data can be used to observe both differences between strains/growth conditions, and variation across genetically identical microcolonies grown in a shared condition. For example, Figure 3A shows the distributions of growth rates for ~12,000 colonies from a mutation-accumulation line (MAH.44)14 and GFP-marked reference strain grown in the same wells, with both differences between the strains and high within-strain variability visible. In Figure 3B, individual growth rates and summary statistics for 10 mutation-accumulation strains, paired with their in-well GFP-marked controls, are shown; the collected data allow precise calculation of small average growth-rate differences.

Figure 3. Large sample sizes of individual microcolony growth rates allow for precise quantification of within-strain and between-strain growth variation. (A) The distributions of growth rates of ~12,000 colonies from two strains. Note differences between the modes of the distributions, as well as the long tail of slow-growing colonies present in each one; the latter is only detectable due to individual microcolony measurements. (B) Distributions of individual microcolony growth rates (black dots) and summary statistics (boxplots showing median, as well as lower and upper 25% quantiles) for ~120,000 colonies from 11 strains. As in (A), each strain was grown in an individual well with a spiked-in GFP-marked reference strain; data shown here represent 14 experimental wells per MAH-reference strain pair. Please click here to view a larger version of this figure.
The microcolony growth assay can also be used to simultaneously measure growth and gene expression by imaging both brightfield and fluorescence channels. In the experiment shown in Figure 2, fluorescent imaging of GFP expression after the completion of the growth phase of the experiment allowed identification of colonies belonging to a GFP-marked in-well reference strain with weak GFP expression (Figure 2C); however, measurement of intercolony differences in gene expression levels across timepoints is also possible (see Discussion).
A number of common pitfalls can prevent collection of accurate growth-rate data or the correct analysis of these data. One key point is that growth-rate measurements rely on the formation of immobile, two-dimensional microcolonies from single founder yeast cells. Concanavalin A interacts noncovalently with polysaccharides on the surfaces of yeast cells to immobilize microcolonies. The bond between concanavalin A and yeast cells can be reversed by competition with sugars or by low pH15. Therefore, strongly acidic media or media containing lectin-binding components such as yeast extract (YEPD) or phthalate (Edinburgh Minimal Media), cannot be used for this assay without modifications to the immobilization technique (Figure 4A).
If the growth assay is being conducted with yeast strains that flocculate, the optional sonication step should be used to break apart aggregated cells so single cells are immobilized on the microscope plate at the beginning of the experiment (see Figure 4B for an example of flocculating cells post-plating if the sonication step is omitted). Any microcolonies that are founded by a cluster of multiple cells should be excluded in downstream analysis, as growth-rate measurements are no longer derived from a single founder cell, and cells may not be growing in two dimensions. Microcolonies that are founded by a budding cell are admissible. The formation of two-dimensional microcolonies is impeded by yeast that flocculate very strongly, even if colonies are founded by a single cell, and therefore the ability of a yeast strain to grow in a single layer on concanavalin A should be tested before conducting a growth assay.
Another important set of considerations comes during both the planning and analysis stages of the experiment, when determining how many timepoints to include in analysis. First, it is important to include data for enough timepoints across a sufficient period of time to accurately track growth: it is recommended that assays are run in such a way that yeast have time to go through ~5 doublings, with at least 10 timepoints collected over that period. However, simply including every collected timepoint in the growth-rate calculation will result in a bias that artificially lowers growth rate for many colonies. This bias can occur when cells go through a lag phase before beginning growth (Figure 4C). Pre-growth lag of microcolonies is common and varies between experimental conditions and strains9,13. Experimental analysis methods must be able to differentiate timepoints in the "active growth" period from pre-growth lag; one approach is to use a pre-set number of timepoints in a window and find the window that corresponds to the highest growth rate (Figure 4C, solid line)11,13.
Finally, one of the most critical steps of the microcolony growth assay is the yeast-cell dilution step. The concentration of cells and the ratio of different genotypes within microscope-plate wells must be carefully controlled. For statistical analysis it is important that experiments be balanced such that approximately equal numbers of cells for each genotype and condition are tested and compared16. In addition, useful growth rates typically cannot be measured after neighboring colonies merge because the growth rates of the individual colonies can no longer be discerned; therefore, more densely plated cells will yield growth data from fewer timepoints (Figure 4D). Importantly, if cell density is high or uneven at the start of an experiment, filtering out merged microcolonies will disproportionately exclude faster growing microcolonies from downstream analyses because fast growers will merge more frequently than slow growers. Therefore, final growth measurements will be biased towards slower-growing sub-populations. Additionally, different numbers of colonies may be filtered out for different treatments, precluding a balanced experiment. It is recommended to plate around 4000 cells per well in a 96-well plate (or 700 cells per well in a 384-well plate). Thorough pipet mixing throughout the yeast-dilution portion of the protocol is imperative to ensure that the correct number of cells is present in each well, and that cells are evenly dispersed throughout the well. It is also advisable to remove any microcolonies from analysis whose centers are within ~25 cell diameters of each other.

Figure 4. Experimental pitfalls. (A) Colonies growing in YEPD media, which prevents efficient binding of cells to concanavalin A. The appearance of new cells far from any colony (arrowheads), as well as the appearance of many out-of-focus cells at the edge of the colony, are the result of cells failing to adhere to the glass surface and drifting away from the colony during growth. (B) Cells from a flocculating strain right after plating without sonication; notice the presence of large numbers of clusters of multiple cells (arrowheads), and cells within the clusters in different focal planes. (C) Change in ln(area) over time for a colony with a long lag phase. Note that if all timepoints are used for growth-rate estimation, the estimated growth rate is significantly depressed; an accurate measurement is produced only when the subset of n timepoints (here n=6) that results in the highest growth rate estimate is used. (D) Cells that were plated too densely shown at the start of the experiment and after 7 h of growth. Colors track individual colonies until they merge with neighbors; here, by the 7-h mark, the majority of colonies have merged, with only a small number of individual slow-growing colonies remaining. (Tracking for a small subset of the colonies shown here is lost for reasons unrelated to colony merging.) Each scale bar is 50 µm. Please click here to view a larger version of this figure.
