A subscription to JoVE is required to view this content.  Sign in or start your free trial.
Confocal Fluorescence Microscopy: A Technique to Determine the Localization of Proteins in Mouse Fibroblasts
  • 00:01Concepts
  • 03:52Preparing Cells for the Antibody Staining
  • 05:35Antibody Staining
  • 06:52Mounting Coverslips
  • 07:47Confocal Imaging
  • 11:07Results

공 초점 형광 현미경: 쥐 섬유 아세포에서 단백질의 국소화를 결정하는 기술

English

Share

Overview

출처: 도미니크 R. 볼리노1,에릭 A. 레겐조브2,토냐 J. 웹1
1 미생물학 및 면역학학과, 메릴랜드 의과 대학 및 말린과 스튜어트 그린바움 종합 암 센터, 볼티모어, 메릴랜드 21201
2 메릴랜드 대학교 의과대학, 볼티모어, 메릴랜드 주 생물의학 공학 및 기술 센터 21201

공초점 형광 현미경 검사는 기존의 “넓은 필드”상피 현미경 검사법과 비교하여 증가 된 광학 해상도를 가능하게하는 이미징 기술입니다. 공초점 현미경은 “레이저 스캐닝”을 통해 향상된 X-y 광학 해상도를 달성 할 수 있습니다 – 일반적으로 한 번에 시편의 각 픽셀에 레이저 조명을 직접 전압 제어 거울 세트 (갈바노미터 또는 “갈보”거울). 더 중요한 것은, 공초점 현미경은 핀홀을 사용하여 스캔되는 z-평면에 없는 위치에서 발생하는 초점 라이트를 제거하여 검출기가 지정된 z-평면에서 데이터를 수집할 수 있도록 함으로써 우수한 z 축 분해능을 달성한다는 것입니다. 공초점 현미경 검사법에서 달성 가능한 z 해상도가 높기 때문에 일련의 z-평면(z-stack이라고도 함)에서 이미지를 수집하고 소프트웨어를 통해 3D 이미지를 생성할 수 있습니다.

공초점 현미경의 메커니즘을 논의하기 전에 샘플이 빛과 상호 작용하는 방법을 고려하는 것이 중요합니다. 빛은 광자, 전자기 에너지 패킷으로 구성됩니다. 생물학적 샘플에 영향을 미치는 광자네는 4가지 방법 중 하나에서 샘플을 포함하는 분자와 상호 작용할 수 있습니다: 1) 광자 상호 작용하지 않고 샘플을 통과; 2) 광자 반사/산란; 3) 광자 분자에 의해 흡수되고 흡수된 에너지는 종합적으로 비방사부패로 알려진 과정을 통해 열로 방출된다; 및 4) 광자가 흡수되고 에너지는 형광으로 알려진 과정을 통해 보조 광자로 급속히 방출된다. 형광 방출을 허용하는 구조가 있는 분자는 형광증이라고 합니다. 대부분의 생물학적 샘플은 무시할 수 있는 내인성 형광을 함유하고 있습니다. 따라서 외인성 형광은 시료에 대한 관심의 특징을 강조하기 위해 사용되어야 합니다. 형광 현미경 검사관 동안, 샘플은 형광소에 의한 흡수를 위한 적당한 파장의 빛으로 조명됩니다. 광자 흡수 시, 플루오로포레는 “흥분”이라고 하며 흡수 과정은 “흥분”이라고 합니다. 형광국이 광자의 형태로 에너지를 포기하면 공정을 “방출”이라고 하며 방출된 광자는 형광이라고 합니다.

형광을 자극하는 데 사용되는 광선은 현미경의 객관적인 렌즈에 초점을 맞추고 최대 적으로 초점을 맞춘 “초점”에 수렴합니다. 초점 너머의 빛이 다시 갈라집니다. 진입 및 종료 빔은 초점에서 접촉하는 원두 쌍으로 시각화될 수 있습니다(그림 1, 왼쪽 패널 참조). 회절 현상은 빛의 광선이 얼마나 단단히 초점을 맞출 수 있는지에 제한을 가합니다 – 빔은 실제로 유한 크기의 지점에 초점을 맞춥니다. 두 가지 요인이 초점 지점의 크기를 결정합니다: 1) 빛의 파장, 2) 목표 렌즈의 광 수집 능력, 이는 그 숫자 조리개 (NA)를특징으로한다. 초점 “스팟”은 x-y 평면뿐만 아니라 z 방향으로확장되며 실제로는 초점 볼륨입니다. 이 초점 볼륨의 치수는 광학 이미징에서 달성할 수 있는 최대 해상도를 정의합니다. 광자의 수는 초점 부피 내에서 가장 크지만 초점 위와 아래에 있는 원적 광 경로에는 광자의 밀도가 낮습니다. 따라서 빛 경로의 모든 불소는 흥분 될 수 있습니다. 종래의 (와이드 필드) 상피 현미경 검사법에서, 초점 비행기 위와 아래형광에서 방출은 이미지 해상도와 대비를 감소시키는 초점 불소 형광(“흐릿한 배경”)을 기여하며, 그림 1에서 입증된 바와 같이, 빨간색 큐브는 평면 초점(빨간 별)의 위 형광 방출을 나타내는 것으로, 오른쪽 초점(빨간 별)의 우측 초점(오른쪽 초점)을 능가하는 것으로 간주합니다. 이 문제는 핀홀의 활용으로 인해 공초점 현미경 검사법에서 개선됩니다. (그림 2, 오른쪽 아래). 그림 3에 설명된 바와 같이 핀홀은 초점 위치에서 발생하는 배출이 검출기(왼쪽)에 도달할 수 있게 해주며, 초점이 맞지 않는 형광(오른쪽)이 검출기에 도달하지 못하도록 차단하여 해상도와 대비를 모두 향상시킵니다.

Figure 1
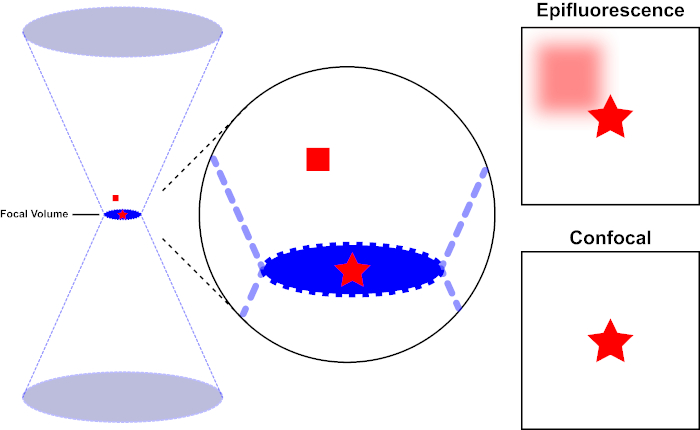
그림 1. 공초점 현미경 검사법과 피성 불피의 광학 해상도. 이 그림의 더 큰 버전을 보려면 여기를 클릭하십시오.

형광을 자극하는 데 사용되는 광선은 현미경의 객관적인 렌즈에 초점을 맞추고 초점 볼륨에서 수렴한 다음 발산 (왼쪽). 적색별은 적색 사각형이 초점 평면 위의 불소 방출을 나타내는 동안 이미지화되는 샘플의 초점 평면을 나타냅니다. 이 샘플의 이미지를 피광성 현미경을 사용하여 캡처할 때 초점이 맞지 않는 빨간색 사각형에서 방출하면 “흐릿한 배경”(오른쪽 상단)이 표시됩니다. 공초점 현미경은 초점 평면 외부에서 방출되는 빛의 검출을 방지하는 핀홀을 가지고 있어 “흐릿한 배경”(오른쪽 아래)을 제거합니다.

Figure 1
그림 2. 공초점 현미경 검사법의 핀홀 효과. 이 그림의 더 큰 버전을 보려면 여기를 클릭하십시오.

흥분광의 가장 높은 강도는 렌즈(왼쪽, 붉은 타원형)의 초점에 있지만, 초점(오른쪽, 붉은 별)에 있지 않은 샘플의 다른 부분은 빛과 형광을 얻을 것이다. 이러한 초점이 닿지 않는 영역에서 발광이 감지기에 도달하는 것을 방지하기 위해 핀홀이 있는 스크린이 검출기 앞에 있습니다. 초점 평면에서 방출되는 초점 표시등(왼쪽)만 핀홀을 통과하여 검출기에 도달할 수 있습니다. 초점이 맞지 않는 라이트(오른쪽)는 핀홀로 차단되어 검출기에 도달하지 못합니다.

Figure 1
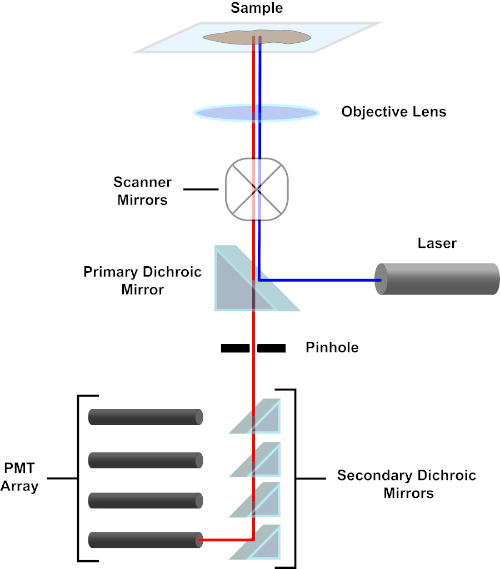
그림 3. 공초점 레이저 스캐닝 현미경의 주요 구성 요소. 이 그림의 더 큰 버전을 보려면 여기를 클릭하십시오.

단순성을 위해, 공초점 현미경의 기계적인 설명은 니콘 이클립스 Ti A1R의 것으로 제한됩니다. 다른 공초점 현미경 사이 사소한 기술적 다름이 있을지도 모르지만, A1R은 공초점 현미경 기능을 설명하기 위한 좋은 모형으로 또한 봉사합니다. 다이오드 레이저의 배열에 의해 생성 된 흥분 광선은, 이미지되는 표본에 빛을 초점을 맞추고 목표에 기본 이차 거울에 의해 반영된다. 1차 이삭 미러는 다른 파장의 빛이 통과할 수 있도록 하면서 흥분 광을 선택적으로 반사합니다. 그런 다음 빛은 x-y 방식으로 표본을 가로 질러 광선을 쓸어 버리는 스캐닝 미러를 마주보고 한 번에 단일(x,y)픽셀을 조명합니다. 조명된 픽셀에서 형광에 의해 방출되는 형광은 객관적인 렌즈에 의해 수집되고 1차 이진거울을 통과하여 광증관(PMTs)의 배열에 도달한다. 이차 이차 이색 거울은 배출광을 적절한 PMT로 직접 지시합니다. 샘플에 의해 다시 분란된 흥분광은 1차 이색 거울에 의해 다시 시편을 향해 반사되어 검출광 경로에 진입하여 PMT에 도달하는 것을 방지한다(그림 3 참조). 이를 통해 비교적 약한 형광은 일반적으로 형광보다 더 강렬한 크기의 순서인 흥분 광 빔에서 산란된 빛에 의해 오염없이 정량화될 수 있습니다. 핀홀은 초점 부피 외부에서 빛을 차단하기 때문에 검출기에 도착하는 빛은 좁고 선택된 z-평면에서 나옵니다. 따라서 일련의 인접 z-평면으로부터 이미지를 수집할 수 있습니다. 이 일련의 이미지를 ‘z-스택’이라고도 합니다. 적절한 소프트웨어를 사용하여 z-스택을처리하여 시편의 3D 이미지를 생성할 수 있습니다. 공초점 현미경 검사법의 특별한 장점은 염색의 세포 소세포 국소화를 구별하는 기능입니다. 예를 들어, 종래의 형광 현미경 검사법(1, 2, 3)으로 매우 어려운 세포 내 염색으로부터 얼룩진 막 사이의 분화.

샘플 준비는 공초점 이미징의 중요한 측면입니다. 광학 현미경 기술의 강도는 살아있는 또는 고정 된 세포를 이미지화하는 유연성입니다. z-스택을 위해 획득해야 하는 이미지의 수, 세포 건강 유지의 어려움, 살아있는 세포 및 세포기관의 이동 으로 인해 3D 이미지를 생성하려고 시도할 때 고정 된 세포의 사용이 일반적입니다. 공초점 형광을 위한 세포를 고정하고 염색하는 절차는 면역 형광에 통상적으로 사용되는 것과 유사합니다. 챔버 슬라이드 또는 커버립에 배양 후, 세포는 세포 형태를 보존하기 위해 paraformaldehyde를 사용하여 고정됩니다. 비특이적 항체 결합은 소 혈청 알부민, 우유 또는 정상 혈청을 사용하여 차단된다. 이차 항체의 특이성을 유지하기 위해, 사용된 용액은 1차 항체가 생성된 동일한 종으로부터 시작되어서는 안된다. 세포는 관심있는 항원결합하는 1 차적인 항체로 배양됩니다. 여러 세포 표적에 라벨을 붙일 때, 1차 항체는 각각 다른 종에서 파생되어야 합니다. 항원태를 태그하는 항체는 그 때 불소-공해된 이차 항체에 의해 구속됩니다. 불소엽공-공주 된 이차 항체는 공초점 현미경에서 사용할 수있는 레이저 여기의 파장과 호환되도록 선택되어야한다. 여러 항원을 시각화할 때 형광의 발각/방출 스펙트럼은 충분히 달라야 미세한 분석에 의해 신호를 차별할 수 있습니다. 염색된 견본은 그 때 화상 진찰을 위한 슬라이드에 장착됩니다. 마운팅 배지는 광표백 및 시편 탈수방지를 위해 사용됩니다. 원하는 경우 핵 카운터스테인(예: DAPI 또는 Hoechst)을 포함하는 장착 배지를 사용할 수 있습니다(4).

다음 프로토콜에서, CD1d(LCD1)를 발현하기 위해 전감염된 마우스 섬유아세포는 CD1d 및 CD107a(LAMP-1)를 인식하는 항체로 염색하였다. CD1d는 지질 항원 제시 세포를 제시하는 항원 제시 세포의 표면에 존재하는 주요 조직 적합성 복합체 1 (MHC 1)와 같은 수용체입니다. LAMP-1 (리소소피 관련 막 단백질-1)은 주로 리소말 막에 존재하는 대막 단백질이다. 적절한 항원 프리젠 테이션을 위해, CD1d는 낮은 pH 리소소말 구획을 통해 인신 매매, 그래서 LAMP-1이 프로토콜에 대한 리소소말 구획의 마커로 사용되고있다. LCD1 세포를 상이한 종에서 생산한 안티 CD1d 및 항-LAMP-1을 통해 조사함으로써, 독특한 형광을 가진 이차 항체는 감광-1 양성 리소냐 구획에 존재하는 각 단백질의 국소화를 결정하는 데 사용될 수 있다.

Procedure

1. 재료 버퍼 세척 버퍼: 칼슘이나 마그네슘이 없는 멸균 인산염 완충식식염(PBS) 1X 고정 버퍼: PBS의 1% 파라포름알데히드 침투 버퍼: PBS에서 0.1% 트리톤 X-100 블로킹 버퍼: PBS의 소 세럼 알부민 1% 세포 성장 배지: DMEM10% 태아 소 혈청으로 보충 (FBS), 페니실린 /연쇄 절제술, 그리고 L-글루타민 <…

Results

In this experiment, mouse fibroblasts expressing the surface glycoprotein gene CD1d were fixed, immunostained and imaged on a confocal microscope. A representative image obtained using the above protocol is shown in Figure 4. In the top panel of A, single-channel images showing the staining pattern of each individual target are presented. These images comprise a single section (slice) of the z-stack captured. The right panel shows DAPI staining of nuclei of the cells. The center panels show CD1d stained in red and LAMP-1, a lysosomal marker, stained in green. The left panel is a composite image where the three different channels are merged. The appearance of yellow results from overlap of the red and green channels, and indicates an area where CD1d and LAMP-1 are co-localized. The results of the staining confirm that CD1d is localized in the LAMP-1+ endosomal compartments. There are also areas where only one color is present, which indicates the presence of CD1d or LAMP-1 without co-localization. The bottom panel of A shows a 3D rendering of the cells constructed from images captured in the z-stack.

Panel B shows a slice out of the z-stack at 100x magnification demonstrating the expression patterns of these two proteins in greater detail. The pink outlined box on the right side of the image displays the cross section of the x-coordinate designated by the pink line in the image, which represents the side view at the pink line. Similarly, the blue outlined box on the bottom of the image shows the cross section of the y-coordinate designated by the blue line in the image, which represents the front view at the blue line. The 3D rendering of the z-stack image enables users to view the image in 3D, visualizing all the x, y and z planes.

Figure 4
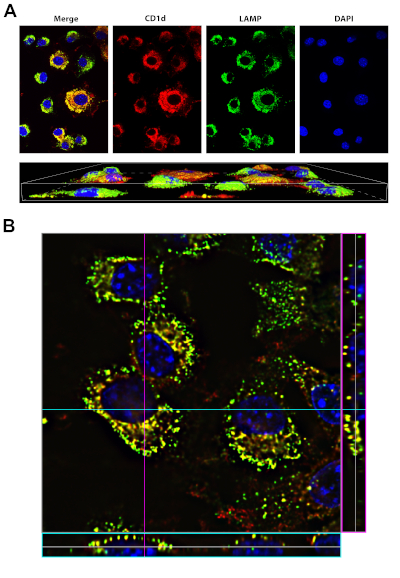
Figure 4: Staining of CD1d and LAMP1. Please click here to view a larger version of this figure.

A, top panel: LCD1 cells were fixed, permeabilized and stained with antibodies to CD1d (red) and LAMP-1 (green, a marker of the lysosomal compartment). DAPI (blue, was used to visualize the nucleus). The merge (left panel) shows that CD1d is localized in the LAMP-1 positive late endosomal/lysosomal compartment (yellow).
A, bottom panel: 3D rendering of the same cells in top panel. Images were acquired using a 40x oil-immersion objective on the Nikon Eclipse Ti, using the NIS Elements Advanced Research software.
B: 100x image of LCD1d cells stained as in A, with stack information for a particular y-coordinate (denoted by the blue line) on the bottom of the image (blue box). The stack information for a particular x-coordinate (denoted by the pink line) is shown on the right side of the image (pink box).

Applications and Summary

Confocal fluorescent staining is a relatively simple procedure that results in extremely high-quality images of specimens that are prepared in a similar way as for conventional fluorescence microscopy. In brief, samples are fixed, permeabilized, then blocked. Primary antibodies against a protein or proteins of interest are allowed to bind, then fluorophore-conjugated secondary antibodies are used to visualize the staining. Confocal fluorescence microscopy has applications in many areas of research. For example, by staining for markers of sub-cellular organelles along with a protein of interest, confocal microscopy can be used to determine the subcellular locations of diverse proteins. Compared to conventional fluorescence microscopy, confocal imaging can more effectively distinguish between cell surface and intracellular location of a protein. In addition, confocal imaging can also be used to determine whether two proteins co-localize within the cell. Although not outlined in this protocol, confocal fluorescence microscopy also can be performed on live cells to detect dynamic changes.

Video 1
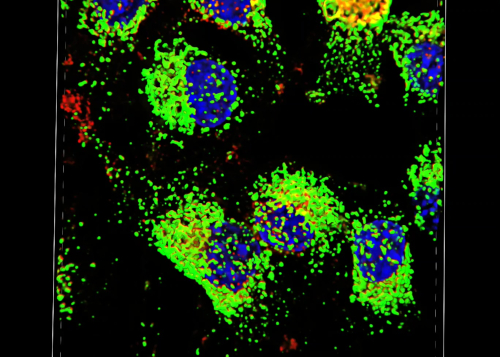
Video 1: Video created in NIS Elements Advanced Research software, highlighting the ability to move through the 3D rendering of the images. Please click here to view this video (Right click to download).

References

  1. Claxton, N. S., Fellers, T. J. and Davidson, M. W. Laser scanning confocal microscopy. Department of Optical Microscopy and Digital Imaging, National High Magnetic Field Laboratory, Florida State University, 37 p., Unpublished (2010). Available at- http://www.vertilon.com/pdf/PP6207.pdf.
  2. Ojcius, D. M., Niedergang, F., Subtil, A., Hellio, R. and Dautry-Varsat, A. Immunology and the confocal microscope. Research in Immunology, 147 (3),175-88 (1996).
  3. Paddock, S. W. and Eliceiri K. W. Laser scanning confocal microscopy: history, applications, and related optical sectioning techniques. Methods in Molecular Biology, 1075, 9-47 (2014).
  4. Hoff. F. How to prepare your specimen for immunofluorescence microscopy. Philipps University Marburg, Institute of Cytobiology and Cytopathology, Germany. (2015) Available at- http://www.leica-microsystems.com.

Transcript

Confocal fluorescence microscopy is a specialized imaging technique for localization of a protein or antigen of interest in a cell or tissue sample by labeling the antigen with an antibody-conjugated fluorescent dye and detecting the fluorescent signal. It offers higher spatial resolution than wide-field fluorescence microscopy, with the help of two pinholes placed at the focal planes of the objective lens, giving it the name confocal. It enables users to visualize the staining at a subcellular level, such as the differentiation between surface membrane staining from intracellular staining.

A confocal microscope follows a similar basic principle as a classic fluorescence microscope. The beam from a light source, usually a laser for confocal, is reflected by a dichroic mirror and focused by an objective lens on the sample. This light excites the fluorophores to emit a different wavelength, which travels back through the objective lens and dichroic mirror to a camera or eyepiece.

The enhanced resolution of a confocal microscope is mainly due to the presence of two pinholes, which are very small holes for light to pass through on the excitation and emission light paths. The pinholes are strategically placed at the focal plane of the objective lens. Now, let’s switch to a side view schematic of the microscope arrangement to review the light path. After passing through the excitation pinhole, the excitation light beam has the effect of originating from a focal point, which enables the objective lens to then focus the light to a point on the sample as well. The emission beam from this focal point converges at the emission pinhole, which allows it to pass through. Now during excitation, fluorophores within the light path, above and below the focal point, are also slightly excited. While the emission light originating from the focal point passes through the pinhole, the emissions from the out-of-focus points converge before or after the emission pinhole, and are hence blocked, resulting in reduced background fluorescence.

The excitation-emission-detection cycle needs to be repeated for each imaging point in the region of interest, which can be done in a few different ways. For example, laser scanning confocal uses galvanometer scanning mirrors, which deflect the excitation light at different angles. Hence, sweeping the light beam across the specimen in the XY plane. Spinning disc confocal uses a disc with an array of pinholes, which rotates to shift the arrangement of the pinholes. This enables users to illuminate multiple small imaging points in the sample each time, gradually covering the whole area as the disc rotates. As a result of the pinholes, the XY image at the detector represents a narrow Z plane. Therefore, images can be collected from a series of consecutive Z planes, often referred to as a Z stack. From these images, an appropriate software can generate a 3D depiction of the fluorescence signal pattern in the sample.

In this protocol, you will observe immunostaining of mouse fibroblasts, followed by imaging on a confocal microscope to differentially visualize a cell surface protein and a lysosomal protein.

To begin, using sterile techniques, resuspend the cells of interest in 500 microliters of growth media per well, and then seed them into the wells of a four-well chamber slide. Here, we are using mouse fibroblasts that were transfected to express the antigen-presenting molecule, CD1d. To allow cells to adhere to the glass, place the chamber slide in a 5% carbon dioxide incubator at 37 degrees Celsius, and incubate overnight. In the morning, aspirate the media from each well, and then wash the cells once with 500 microliters of PBS for a few seconds.

To fix the cells, add 500 microliters of 1% paraformaldehyde solution into each well, and incubate for 15 minutes at room temperature. After the incubation, collect the paraformaldehyde into an appropriate hazardous liquid waste container, and then remove any remnants of the fixative by washing the cells three times with PBS for a few seconds.

To allow antibody penetration into the cells, add 500 microliters of permeabilization buffer to each well, and incubate on the bench for 15 minutes at room temperature. After permeabilization, wash the cells briefly three times with 500 microliters of PBS. Next, add 500 microliters of blocking buffer to each well, and incubate for one hour at four degrees Celsius to prevent nonspecific antibody binding.

Prepare the primary antibodies, anti-CD1d and anti-LAMP-1, at appropriate working concentrations. Then, aspirate the buffer from the wells and cover the cells in each well with 500 microliters of diluted primary antibody solution and then incubate the slide on a flat surface overnight at four degrees Celsius. The next morning, dilute the secondary antibodies, in this case an anti-mouse and anti-rat antibody with distinct fluorescent tags, in blocking buffer to appropriate working concentrations. Next, aspirate the primary antibody solution from the wells and then wash the cells four times with 500 microliters of PBS. Then, add 500 microliters of the diluted secondary antibody solution to each well, and incubate at room temperature for one hour in the dark. After the incubation, aspirate the secondary antibody solution and wash the wells four times with 500 microliters of PBS to remove any unbound secondary antibody.

To mount the samples after the final wash, carefully detach and remove the chambers from the slide. To remove the residual PBS, hold the slide at an angle over a delicate task wipe, and remove the fluid from the edges without touching the cells. Once the excess PBS is removed, add one drop of antifade mounting medium, containing the nuclear stain DAPI, onto each section of cells. Next, take a 20-by-60-millimeter coverslip, and using just fingertips start lowering the coverslip slowly on either edge, taking care to avoid bubble formation over the cells. Wipe off any extra mounting medium on the slides with a delicate task wipe and store the slides in the dark at room temperature for up to a week.

To begin imaging the cells, first click on the NIS software icon on the desktop. Once in the control window, click on the TiPad tab at the top, and choose the desired objective for imaging. Then, load the slide with cells onto the stage, and center it beneath the lens. Next, on the A1plus Compact GUI tab next to the TiPad tab, set up the lasers appropriate for the fluorophores used. Click on the gear symbol to open the dye and spectral settings menu. Once the dye and spectral settings menu is open, select the channels needed and set the laser for each channel. Then, select the appropriate emissions in the drop down menu under the first dichroic mirror. Next, under A1plus Compact GUI window, click on Ch.Series to set up the line channel series, which sets up whether the lasers used will fire on the sample simultaneously or sequentially.

After that, start scanning by clicking the arrow-tip icon on the top. At this point, while the imaging is live, under A1plus Compact GUI window, click on the sliding scale, and modify the pinhole size to assure limiting out-of-focus light. Next, adjust the high voltage and offset settings under each laser to appropriate levels by using the sliding scales to enable detection of the specific staining while limiting any potential background staining. If a positive staining sample is available, start by imaging this sample for each channel to make sure the laser settings yield optimal signal-to-noise ratios. After setting the optimal HV and offset values for each laser, click on the ND Acquisition tab, and then select the Z icon to set up the parameters for the z series.

Next, while acquiring a live image of the sample, first set the bottom by finding the bottom of the image and clicking the bottom button. Then, find the top position of the sample and click the top button. Set the step size either by specifically typing the preferred step size in microns for each step or by specifying how many total steps are needed. To select the desired size/ pixel resolution of the image, click the Aiplus Compact GUI window, and under the size icon, select the desired resolution.

To decrease the noise of the image, you can select the drop-down menu next to the theta symbol to average the selected number of images. After this, click the Run Now tab on the ND Acquisition menu in order to start imaging the sample. After imaging is complete, save the image by clicking file, then save as, which will export the image file with the extension dot-nd2. Finally, repeat the process for each of the other samples.

In this experiment, mouse fibroblasts expressing the surface glycoprotein gene CD1d were fixed, immunostained, and imaged on a confocal microscope. This image shows a single section of a Z stack at 40X magnification, where CD1d is stained in red. The sample was costained with LAMP-1, a lysosomal marker, in green. Nuclear stain DAPI was used to show the nuclei of the cells.

In a composite image where the three different channels are merged, the appearance of yellow results from overlap of the red and green channels, and indicates an area where CD1d and LAMP-1 are co-localized in the lysosomes. Areas where only one color is present indicate the presence of CD1d or LAMP-1 without co-localization. This image shows a 3D rendering of the cells constructed from images captured in the z-stack and this method enabled the construction of a side view of this group of cells. This following image shows a slice out of the z-stack at 100X magnification, demonstrating the expression patterns of these two proteins in greater detail. The pink outlined box on the right side of the image displays the cross-section of the x-coordinate designated by the pink line in the image, which represents the side view at the pink line. Similarly, the blue outlined box on the bottom of the image shows the cross-section of the y-coordinate designated by the blue line in the image, which represents the front view at the blue line. The 3D rendering of the z-stack image enables users to view the image in 3D, visualizing all of the x, y, and z planes. This can be used to study co-localization of the different stains at different regions within the cell.

Tags

Cite This
JoVE Science Education Database. JoVE Science Education. Confocal Fluorescence Microscopy: A Technique to Determine the Localization of Proteins in Mouse Fibroblasts. JoVE, Cambridge, MA, (2023).