Summary

Whole-Mount Staining, Visualization, and Analysis of Fungiform, Circumvallate, and Palate Taste Buds

Published: February 11, 2021
doi:

Summary

This paper describes methods for tissue preparation, staining, and analysis of whole fungiform, circumvallate, and palate taste buds that consistently yield whole and intact taste buds (including the nerve fibers that innervate them) and maintain the relationships between structures within taste buds and the surrounding papilla.

Abstract

Taste buds are collections of taste-transducing cells specialized to detect subsets of chemical stimuli in the oral cavity. These transducing cells communicate with nerve fibers that carry this information to the brain. Because taste-transducing cells continuously die and are replaced throughout adulthood, the taste-bud environment is both complex and dynamic, requiring detailed analyses of its cell types, their locations, and any physical relationships between them. Detailed analyses have been limited by tongue-tissue heterogeneity and density that have significantly reduced antibody permeability. These obstacles require sectioning protocols that result in splitting taste buds across sections so that measurements are only approximated, and cell relationships are lost. To overcome these challenges, the methods described herein involve collecting, imaging, and analyzing whole taste buds and individual terminal arbors from three taste regions: fungiform papillae, circumvallate papillae, and the palate. Collecting whole taste buds reduces bias and technical variability and can be used to report absolute numbers for features including taste-bud volume, total taste-bud innervation, transducing-cell counts, and the morphology of individual terminal arbors. To demonstrate the advantages of this method, this paper provides comparisons of taste bud and innervation volumes between fungiform and circumvallate taste buds using a general taste-bud marker and a label for all taste fibers. A workflow for the use of sparse-cell genetic labeling of taste neurons (with labeled subsets of taste-transducing cells) is also provided. This workflow analyzes the structures of individual taste-nerve arbors, cell type numbers, and the physical relationships between cells using image analysis software. Together, these workflows provide a novel approach for tissue preparation and analysis of both whole taste buds and the complete morphology of their innervating arbors.

Introduction

Taste buds are collections of 50-100 specialized epithelial cells that bind subsets of chemical-taste stimuli present in the oral cavity. Taste-transducing cells are generally thought to exist as types1,2,3,4,5,6,7,8,9, initially based on electron microscopy criteria that were later correlated with molecular markers. Type II cells express phospholipase C-beta 2 (PLCβ2)2 and transient receptor potential cation channel, subfamily M member 51 and include cells that transduce sweet, bitter, and umami1,10. Type III cells express carbonic anhydrase 4 (Car4)11 and synaptosomal-associated protein 258 and denote cells that primarily respond to sour taste11. The cells that transduce saltiness have not been as clearly delineated12,13,14, but could potentially include Type I, Type II and Type III cells15,16,17,18,19.The taste-bud environment is complex and dynamic, given that taste-transducing cells continuously turn over throughout adulthood and are replaced by basal progenitors3,20,21. These taste-transducing cells connect to pseudo-unipolar nerve fibers from the geniculate and petrosal ganglia, which pass taste information to the brainstem. These neurons have primarily been categorized based on the kind of taste information they carry22,23 because information about their morphology has been elusive until recently24. Type II cells communicate with nerve fibers via calcium homeostasis modulator protein 1 ion channels25, whereas Type III cells communicate via classical synapses8,26. Further characterization of taste bud cells-including transducing cell type lineages, factors that influence their differentiation, and the structures of connecting arbors are all areas of active investigation.

Taste-bud studies have been hindered by several technical challenges. The heterogenous and dense tissues that make up the tongue significantly reduce antibody permeability for immunohistochemistry27,28,29. These obstacles have necessitated sectioning protocols that result in the splitting of taste buds across sections so that measurements are either approximated based on representative sections or summed across sections. Previously, representative thin sections have been used to approximate both volume values and transducing-cell counts30. Thicker serial sectioning allows for the imaging of all taste-bud sections and the summing of measurements from each section31. Cutting such thick sections and selecting only whole taste buds biases sampling towards smaller taste buds32,33,34. Nerve innervation estimates from sectioned taste buds have been based on analyses of pixel numbers13,35, if quantified at all36,37,38. These measurements completely ignore the structure and number of individual nerve arbors, because arbors are split (and usually poorly labeled). Lastly, although peeling away the epithelium does permit entire taste buds to be stained39,40, it also removes taste-bud nerve fibers and could disrupt the normal relationships between cells. Therefore, investigations of the structural relationships within taste buds have been limited because of this disruption caused by staining approaches.

Whole-structure collection eliminates the need for representative sections and allows the determination of absolute-value measurements of volumes, cell counts, and structure morphologies41. This approach also increases accuracy, limits bias, and reduces technical variability. This last element is important because taste buds show considerable biological variability both within34,42 and across regions43,44, and whole taste-bud analyses allow absolute cell numbers to be compared between control and experimental conditions. Furthermore, the ability to collect intact taste buds permits the analysis of the physical relationships between different transducing cells and their associated nerve fibers. Because taste-transducing cells may communicate with each other45 and do communicate with nerve fibers46, these relationships are important for normal function. Thus, loss-of-function conditions may not be due to a loss of cells, but instead to changes in cell relationships. Provided here is a method for collecting whole taste buds to achieve the benefits of absolute measurements for refining volume analyses for both taste buds and their innervations, taste-cell counts and shapes, and for facilitating analyses of transducing-cell relationships and nerve-arbor morphologies. Two workflows are also presented downstream of this novel whole-mount method for tissue preparation: 1) for analyzing taste bud volume and total innervation and 2) for sparse-cell genetic labeling of taste neurons (with subsets of taste-transducing cells labeled) and subsequent analyses of taste-nerve arbor morphology, numbers of taste-cell types and their shapes, and the use of image analysis software to analyze the physical relationships between transducing cells and those between transducing cells and their nerve arbors. Together, these workflows provide a novel approach to tissue preparation and for the analyses of whole taste buds and the complete morphology of their innervating arbors.

Protocol

NOTE: All animals were cared for in accordance with the guidelines set by the U.S. Public Health Service Policy on the Humane Care and Use of Laboratory Animals and the NIH Guide for the Care and Use of Laboratory Animals. Phox2b-Cre mice (MMRRC strain 034613-UCD, NP91Gsat/Mmcd) or TrkBCreER mice (Ntrk2tm3.1(cre/ERT2)Ddg) were bred with tdTomato reporter mice (Ai14). AdvillinCreER47 were bred with Phox2b-flpo48 and Ai65. For 5-ethynyl-2′-deoxyuridine (EdU) injections, the EdU was prepared and doses calculated according to Perea-Martinez et al.49.

1. Preparation of materials

  1. Preparation of solutions
    1. Dissolve 5.244 g of monobasic sodium phosphate and 23.004 g of dibasic sodium phosphate in double-distilled water (ddH2O) on a stir plate. Adjust the pH to 7.4, and bring the total volume to obtain 1 L of 0.2 M sodium phosphate buffer (PB).
    2. Dissolve paraformaldehyde in ddH2O in a fume hood by heating while stirring on a stir plate until the solution reaches 90 °C. Add 4 M NaOH solution dropwise to clear the paraformaldehyde, and filter the solution using a vacuum Erlenmeyer flask and ceramic filter with filter paper. Add an equal volume of 0.2 M PB, and adjust the pH to 7.4 to obtain 4% PFA in 0.1 M PB.

2. Tissue preparation

  1. Tissue collection
    1. Sacrifice mice using an anesthetic overdose with a working solution containing 10 mL of sterile saline and 0.25 mL of a stock solution containing 5 g of 2,2,2-tribromoethanol and 5 mL of tert-amyl alcohol. Perfuse transcardially with 4% PFA in 0.1 M PB; remove the tongues and the palate.
    2. Isolate the circumvallate taste buds using a coronal cut separating the posterior tongue, behind the intermolar eminence; cut off the taste buds with a razorblade; and then bisect the anterior tongue at the midline. Post-fix overnight at 4 °C with 4% PFA in 0.1 M PB.
    3. Cryoprotect the tissue in 30% sucrose overnight at 4 °C.
      ​NOTE: The tissue can be frozen in optimal cutting temperature (OCT) compound using 2-methylbutane chilled in a beaker on dry ice and stored at -80 °C if the procedure has to be paused here.
  2. Fungiform taste buds
    1. Chill 2-methylbutane in a beaker on dry ice in preparation for step 2.2.8.
    2. Thaw and rinse the tongue in 0.1 M PB. Place one half of the anterior tongue containing the fungiform papillae on a glass slide under a dissecting microscope.
    3. Use blunt-ended forceps and dissection scissors to remove the muscle. Use blunt-ended forceps to hold the tissue open as the lingual epithelium is curved, and ensure a flat orientation by keeping the blades of the coarse dissection scissors parallel to the epithelium.
    4. Discard the ventral non-keratinized epithelium of the tongue as it contains no taste buds.
    5. Use fine dissection scissors for closer dissection to the underside of the keratinized epithelium.
      ​NOTE: It is important to dissect close to the epithelium so that the remaining muscle is of uniform thickness, and the surface is smooth to ensure uniform antibody penetration. The consequence of non-uniform thickness of the remaining muscle will be uneven sectioning on the cryostat, with exposure of the epithelium in areas with less muscle and a thicker layer of muscle for other areas, which impedes antibody penetration.
    6. Use the blunt-ended forceps to lay a piece of epithelium into a tissue mold (muscle side down), and ensure that it lays flat. Once the tissue is flat, add a drop of OCT to the tissue.
      ​NOTE: Given that the tip of the tongue is curved, it may be necessary to make a cut in the epithelium where it is curved so that the tissue can be made to lay flat.
    7. Place the tissue mold on a metal base (previously cooled in dry ice) under the dissecting scope. Continue to tap the tissue lightly with the forceps until the OCT has frozen to ensure the tissue freezes as flat as possible.
    8. Once the OCT has frozen, quickly add additional OCT, and place the mold in a beaker of 2-methylbutane (cooled in dry ice) until frozen.
    9. Cryostat sectioning
      NOTE: The cryostat is used for fine removal of remaining subcutaneous tissue, which may inhibit antibody penetration (Figure 1).
      1. Mount the OCT molds on the cryostat, and cut 20 µm sections. Collect each section, and view it under the light microscope to assess its proximity to the base of the epithelium (Figure 1E – H).
      2. After the tissue is shaved from the underside of the epithelium, thaw the epithelium and rinse it twice in 0.1 M PB on a shaker.
  3. Circumvallate taste buds
    1. Using a coronal cut with a razorblade, separate the circumvallate papilla from the anterior tongue. Use two parasagittal cuts with the same razorblade to remove the tissue lateral to the papilla under a dissecting scope. Place the papilla in a tissue mold using forceps so that one lateral edge of the circumvallate papilla faces the bottom of the tissue mold.
      NOTE: The tissue can be frozen in OCT using 2-methylbutane chilled in a beaker on dry ice and stored at -80 °C if the procedure has to be paused here.
    2. Cut the tissue into 90 μm floating sections on the cryostat.
  4. Taste buds on the palate
    1. Cut the hard palate anterior to the junction of the soft and hard palate (Figure 2). Use scissors to separate the soft palate from the underlying tissue, making sure any remaining bone fragments are cut away. Remove additional muscle and connective tissue.
      NOTE: Once removed, all tissue that remains will consist of glands and loose connective tissue, which are lightly adhered to the underside of the palate.
    2. Hold the palate with blunt-ended forceps, and remove the remaining glands and loose connective tissue by gently scraping them with a razor blade.
      NOTE: The tissue can be frozen in OCT using 2-methylbutane chilled in a beaker on dry ice and stored at -80 °C if the procedure has to be paused here.

3. Immunohistochemistry staining

  1. Wash the tissues with 0.1 M PB, 3 x 15 min. Place the tissues in 1 mL tubes with blocking solution (3% donkey serum, 0.5% non-ionic surfactant (see the Table of Materials), 0.1 M PB) at 4 °C overnight.
  2. Remove the blocking solution, and incubate the tissue in primary antibody (rabbit anti-PCLβ2) in antibody solution (0.1 M PB, 0.5% non-ionic surfactant) for 5-days at 4 °C.
  3. Wash with 0.1 M PB, 4 x 15 min each wash, and incubate in secondary donkey anti-rabbit 488 antibody (1:500) in antibody solution for 2 days at 4 °C.
  4. Wash with 0.1 M PB, 4 x 15 min each wash, and block with 5% normal rabbit serum in antibody solution.
  5. Wash with 0.1 M PB, 4 x 15 min. Incubate with donkey anti-rabbit blocking antibody (20 µg/mL) in antibody solution for 2 days at 4 °C.
  6. Wash with 0.1 M PB, 4 x 15 min each wash, and then incubate with primary antibody dsRed (rabbit) conjugated to a fluorescent label (according to the manufacturer's instructions) in an antibody solution for 5 days at 4 °C.
  7. Wash with 0.1 M PB, 4 x 15 min each wash, and then incubate with primary antibody (goat anti-Car4 (1:500)) in antibody solution for 5 days at 4 °C.
  8. Wash with 0.1 M PB, 4 x 15 min each wash. Incubate with secondary donkey anti-goat 647 antibody (1:500) in antibody solution for 2 days at 4 °C.
  9. Wash with 0.1 M PB, 4 x 15 min each wash, and mount (epithelial side up) in aqueous mounting media, and place a coverslip over the tissue section.
    ​NOTE: If using antibodies from different species, as in the case with keratin-8 and dsRed only, add all primary antibodies to the antibody solution in step 3.2 and all secondary antibodies in step 3.3 before proceeding to step 3.9.

4. Confocal imaging and deconvolution

  1. Capture confocal images using a confocal microscope with a 60x objective (Numerical Aperture= 1.40), 4 ms/pixel, zoom of 3, Kalman of 2, and size of 1024 x 1024. Select a step size of 0.47 mm along the z-axis. For capturing innervation to the papilla, use a zoom of 2.5 if the field of view with a zoom of 3 is too narrow to capture all the innervation to the papilla.
  2. To deconvolute the images, note that some settings will automatically import with the image; therefore, fill in the remaining details for modality, objective lens, numerical aperture, immersion medium, sample medium, and fluorophores captured in the image. Then, select 3D Deconvolution.

5. Image analysis

  1. Taste bud and innervation volume
    1. Import deconvoluted image stacks to a pixel-based image analysis software (see the Table of Materials) to determine the taste bud volume and volume of total innervation within the taste bud.
      1. Uncheck Volume in the main Object menu.
      2. Select Add new surfaces from the Object menu. Select Skip automatic creation, edit manually, and then select Contour.
      3. Click on Select and observe the arrow appearing as a + to help trace the border of the taste bud. Move the slicer and outline the taste bud in each optical section. Once the contours are complete, click on Create Surface.
      4. Observe the taste-bud volume object now appearing in the main Object menu. Locate the volume of the taste bud under Tools.
    2. Volume of innervation within the taste bud
      1. Select the pencil icon under the taste bud object, then select Mask All.
      2. In the dropdown menu, select the fluorescent channel that corresponds with the nerve fiber label. Check Create Duplicate Channel.
      3. Check Set voxels outside surface to:, and type 0 in the box.
      4. Observe the new channel appearing in the Display Adjustment window, which is an unaltered duplicate of the fluorescent channel selected within the taste bud.
      5. In the main Object menu, select Create New Surface. Uncheck Skip automatic creation, edit manually.
      6. Click twice on the blue arrow to proceed to the next step.
      7. Click on Delete, then click on the green double arrow to complete the surface, which represents the volume of the nerve fibers present within the taste bud. To find the value for the volume, select Tools under the nerve fiber Object menu, and select Volume from the dropdown menu.
    3. Volume of innervation to the papilla
      1. Create a volume of the taste bud as described in section 5.1.
      2. Select the pencil icon under the taste-bud object, then select Mask All.
      3. In the dropdown menu, select the fluorescent channel that corresponds with the nerve fiber label. Check Create Duplicate Channel.
      4. Check Set voxels inside surface to: and type 0 in the box. Click OK.
      5. Generate a surface by clicking on Add New Surface. Select Segment only a Region of Interest.
      6. Click on the blue arrow, and increase the Z-value so that the region of interest begins at the base of the taste bud.
      7. Click twice on the blue arrow to proceed to the next step.
      8. Click on Delete, then click on the green double arrow to complete the surface, which represents the volume of the innervation to the papilla. To find the value for the volume, select Tools under the nerve fiber Object menu, and select Volume from the dropdown menu.
    4. Terminal arbor contact analysis
      1. Image preparation
        1. Go to the Edit menu and select Crop 3D. Crop the image on all sides, removing space outside of the taste bud.
          NOTE: Crop as close to the taste bud without removing any relevant structure-any excess image will lengthen processing time.
        2. Select Edit from the main menu, click Change data type. Select To: 32 bit float from the dropdown menu.
        3. Select Add new surfaces from the Object menu. Click on Skip automatic creation, edit manually, select Contour, and then drag the slice position to the right to find the total number of optical slices.
        4. Generate isometric voxels, and make sure that instead of the voxels being rectangles (0.0691 x 0.0691 x 0.474) as XxYxZ, respectively, the voxels are 0.0691 x 0.0691 x 0.0691 by dividing the rectangles into cubes with identical values for fluorescence intensity as the original, rectangular voxel. Select Image Properties. Then, divide the Z value for Voxel Size by the X or Y value (= 0.474/0.0691), and multiply that value by the number of slices (optical sections) found in the previous step.
        5. Go back to Edit on the main menu, and select Resample 3D.
        6. Replace the Z value (number of slices) with the newly calculated value.
      2. Creating automatic surfaces based on fluorescence
        1. Click on Add New Surface again to add a new surface, deselect Segment only a region of interest, and click on Next.
        2. From the Source channel dropdown menu, select the channel for one of the taste-transducing cell types. Unselect Smooth and continue to the next step.
        3. Do not alter anything on the next screen that shows the range of fluorescent intensities present in the image. Click on the blue arrow at the bottom again to move to the next step.
        4. Click on Delete, then click on the green double arrow to complete the surface.
        5. Go to the Object menu on the left hand of the screen where the completed cell surface will appear and will be called something generic such as Surface 2. Double click on the surface name to name it according to what the label represents.
          NOTE: In this case, the surface generated is based on the PLCß2-labeled cell.
        6. If there are dots instead of a surface, under the menu in the lower left-hand corner, click on Surface instead of Center point. Then, click OK when prompted.
        7. Repeat steps 5.3.2.1-5.3.2.5 for the other taste-transducing cell markers and the nerve fiber marker.
        8. Save (export) the progress.
        9. Click on a cell type Surface in the main menu. From that object's menu, click on Tools, then click on Distance Transformation.
        10. Wait for a pop-up box entitled XTDistanceTransformation to appear. Select Outside Surface Object. Make note of the new channel that appears in the Display Adjustment menu called Distance to surface name.
        11. Select the Nerve Fiber surface from the Object menu. Click on the pencil icon and then Mask All.
        12. From the dropdown menu that appears, select the new channel Distance to surface name. Make note of the new channel that appears in the Display Adjustment window called Masked Distance to surface name.
        13. Create a new object using the main Object menu. Unselect Segment only a region of interest and click on the blue arrow. Select the Masked Distance to PLCß2 channel and uncheck Smooth.
        14. On the next screen, check if there are any regions where the taste-transducing cells are within the smallest distance from the nerve fibers discernable by this software. To do this, set a limit of 0.01-0.11 µm to check for any receptor cell fluorescence this close to the nerve fibers.
        15. Type 0.01 in the green box on the left side to set the lower threshold, press Tab. Then click on the red button and type 0.11 to set the upper threshold. Press Tab and then click on the blue arrow at the bottom to move on to the next step.
        16. Click on Delete and then the green double arrow to finish.
        17. Rename this surface Within 0.01-0.11 of PLCß2 in the Object menu. Select Within 0.01 – 0.11 of PLCß2 surface in the Object menu.
        18. Select the pencil then click on Mask All. Select the red (nerve fiber) channel from the dropdown menu and click OK. Make note of the new channel that appears in the Display Adjustment window called Masked CHS2.
        19. Click on the name of the channel; rename the channel Within 0.01 – 0.11 of PLCß2.
          NOTE: This is a fluorescent channel that represents a duplicate of the red fluorescent channel present within the surface created.
        20. Click on white in the middle of the color selector. Select a color that contrasts with the colors of the structures.
        21. Export (i.e., save) the file at this stage.
        22. Repeat steps 5.4.2.9-5.4.2.21 for other taste-transducing cell markers.
        23. Export (i.e., save) the file at this stage.
          NOTE: To analyze the proximity of one labeled cell type to another, simply replace the Nerve Fiber surface in step 5.4.2.11 (and the following steps) with the object of interest and the equivalent components that pertain to each subsequent steps.

6. Neuron arbor reconstruction and absolute cell number quantification

  1. Terminal arbor tracing and analysis
    1. Open the deconvoluted image file in a 3D vector-based image analysis software (see the Table of Materials), select Trace, click on Neuron, and then click on Dendrite.
    2. Scroll to the base of the taste bud in the image stack. Trace each fiber to the end while scrolling through the image stack.
    3. When at the branch end, right click on the end and select Ending. At branch points, right click and select Bifurcating Node.
      NOTE: This enables tracing one branch to the end and then returning to the bifurcating point and tracing the other branch with the program recognizing that this tracing is still of the same neuron.
    4. Save the data file as a .DAT file, which can then be opened for analysis in the 3D vector-based image analysis software.

7. Cell number quantification

  1. Quantify the labeled taste bud cells in any image analysis software package as long as distinct markers for transducing cell types anchored to the z-position can be placed at the nuclear level.

Representative Results

Staining of the lingual epithelium with antibodies to dsRed and keratin-8 (a general taste-bud marker) labeled both whole taste buds and all taste-bud innervation in Phox2b-Cre:tdTomato mice50,51 (Figure 3A). Imaging these taste buds from their pores to their bases gave the highest resolution x-y plane images (Figure 3A,B). The contour function of the pixel-based imaging program was used to outline the periphery of the taste bud in each section (Figure 3B), and then generate a surface (Figure 3C) that represented taste bud volume. Masking (or duplicating) the fluorescence associated with the taste-bud label only within the surface created a new channel that contained only this fluorescence and eliminated any papilla staining obscuring the taste bud (Figure 3D). The nerve fiber fluorescence within the taste bud was masked (Figure 3E) and used to automatically create a surface representing the volume of innervation within it (Figure 3F). A similar approach was also used to measure taste-bud volume and that of its associated innervation in circumvallate taste buds (Figure 3G). Representative measurement data revealed no correlations between taste-bud volumes and innervation volumes in either the fungiform (p = 0.115) or the circumvallate (p = 0.090) measurement regions (Figure 3H).

The administration of a low dose of tamoxifen in TrkBCreER:tdTomato mice causes gene recombination and the labeling of a small number of neurons so that taste buds are innervated by zero to a few labeled terminal arbors (the neuronal portion within the taste bud). The lingual epithelium was stained using an anti-dsRed antibody for the terminal arbors and anti-Car4 (sour) and anti-PLCβ2 (sweet, bitter, and umami) antibodies for the taste-transducing cells (Figure 4A). A vector-based image analysis program was used to trace the labeled terminal arbors (Figure 4B). The orthogonal heights of the arbors associated with the blue and green tracings were 33.4 µm (Figure 4C) and 32.4 µm (Figure 4D), respectively. The 3D Convex Hull measurements (i.e., the extent of the terminal arbor within the taste bud) for the blue terminal arbor was 644.0 µm3 and 3647.0 µm3 for the green arbor. The dendrogram for the green tracing is shown in Figure 4E with branch lengths measured in microns. The green arbor had seven branch ends and a total length of 183.4 µm. Quantification of the absolute numbers of PLCβ2+ and Car4+ cells revealed that this taste bud had 17 PLCβ2+ cells and two Car4+ cells. Using cell pixel-based imaging software to determine the closest proximity between nerve fibers and taste-transducing cells revealed that out of a total of 19 taste-transducing cells in the taste bud, the blue terminal arbor (shown in red in Figure 4F,G) was within 200 nm (the resolution of the light microscope) of the light blue Car4+ cell (white areas indicated by arrows in Figure 4G). The terminal arbor associated with the green tracing is shown in magenta (Figure 4F and Figure 4H) and is within 200 nm of both the light and dark blue Car4+ cells (white areas in Figure 4H). As the next closest cell to these arbors was more than 200 nm away, there was an unlabeled voxel separating the two structures.

Dividing progenitor cells were labeled using injections of EdU on Days 0, 1, and 3, and tissues were collected on Day 4. Whole-mount keratin-8 and EdU staining of fungiform taste buds revealed that EdU-labeled cells were present both within and outside of the taste buds (Figure 5AC). Individual EdU+/keratin-8+ cells (teal and yellow) and EdU+/keratin-8- nuclei (purple and magenta) were segmented (Figure 5B,C). The dark blue cell shown was keratin-8+ and had an elongated shape consistent with mature taste-transducing cells. These surfaces are shown with the taste bud oriented from pore-to-base (Figure 5B) and along the long axis of the taste bud (Figure 5C). Each structure could be viewed in individual optical slices by masking the fluorescence within each structure (Figure 5DF). The magenta and purple nuclei are outside of the keratin-8+ border of the taste bud indicated by the white-dotted outline (Figure 5D,E). The yellow, teal, and blue cells were within the taste bud (Figure 5DF). Individual taste-transducing cells could be reconstructed using pixel-based imaging software of either Car4 labeling (Figure 6AC) or PLCβ2 labeling (Figure 6DF). A pixel-based imaging software was be used to measure the closest proximity between cells revealed that a Car4+ cell (same cell as shown in Figure 6B) was within 200 nm of a single PLCβ2+ cell (Figure 6G, green). The area where the cells were within 200 nm of each other is shown in white (Figure 6G) and indicated by white arrows. The next closest cell was more than 200 nm away and is shown in yellow in Figure 6H,I in two different orientations. Figure 7 demonstrates the isolation and analysis of the innervation terminating within the papilla (but outside the taste bud) and includes its distribution around the taste bud and its distance from the epithelium.

Figure 1
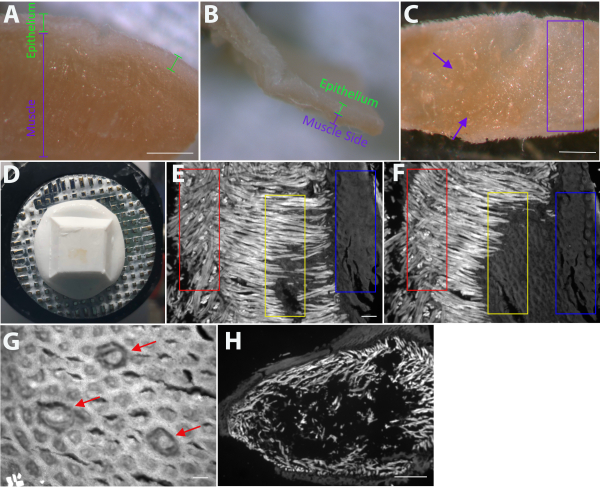
Figure 1: Preparation of lingual epithelium for fungiform taste-bud staining. (A) View of the cut tongue with epithelium and muscle labeled prior to any dissection. (B) Once enough muscle has been removed, there is only a small amount of remaining muscle on the underside of the epithelium. In addition to evaluating the progress of the dissection by viewing the cut side of the epithelium, (C) laying the epithelium flat on a glass slide under the dissecting scope reveals that some portions of the tissue are evenly translucent (purple rectangle); enough muscle has been removed from this area. In contrast, the purple arrows indicate regions on the left where there is more muscle that needs to be removed. Once the entire underside of the epithelium is similar to the area in the purple rectangle, proceed to the next step. (D) After portions of the epithelium have been frozen with the muscle side down, additional muscle and lamina propria are removed as thin sections using the cryostat. When sectioning is complete, the remaining epithelium is thin and translucent. (EF) Serial sections (20 µm) were collected on a glass slide, and each section was viewed under a fluorescent microscope before cutting the next section. Well below the epithelium, muscle fibers are oriented in multiple directions so that muscle fibers are present both in cross section and along the muscle fiber (E, red rectangle). The serial sections in EF demonstrate the transition from muscle fibers oriented in multiple directions (E, red rectangle) to muscle fibers being oriented mostly in one direction (F, red rectangle), which is indicative of the muscle-lamina propria border. Another region of the same piece of tissue (yellow rectangles) demonstrates that when the muscle fibers are oriented in one direction, the next section will likely yield connective tissue because all muscle has been removed from that region. The blue rectangles both represent the underside of the epithelium. If taste buds are present on the section (G, red arrows), too much tissue has been removed. Ideally, sectioning is complete when the underside of the epithelium (but no taste buds) is visible in the removed sections (F, yellow rectangle). Although areas with muscle fibers oriented in the same direction (E, yellow rectangle and F, red rectangle) are also suitable for sectioning, areas where the muscle fibers are oriented in multiple directions (E, red rectangle) should be avoided. (G) Once sections include the underside of the epithelium/lamina propria, it is only possible to cut a few additional sections before too much of the epithelium has been removed and sections include taste buds. (H) The most common mistake is revealed by cryostat sections where epithelium is seen at the edge of the tissue, muscle is seen inside of the epithelium, and OTC/sparse muscle is present in the middle. This is most often due to not laying the tissue flat on the bottom of the tissue mold before freezing or insufficient flattening with blunt-ended forceps. Scale bars in AC = 1 mm; scale bars in E, F, H = 100 µm; scale bar in G = 50 µm. Please click here to view a larger version of this figure.

Figure 2
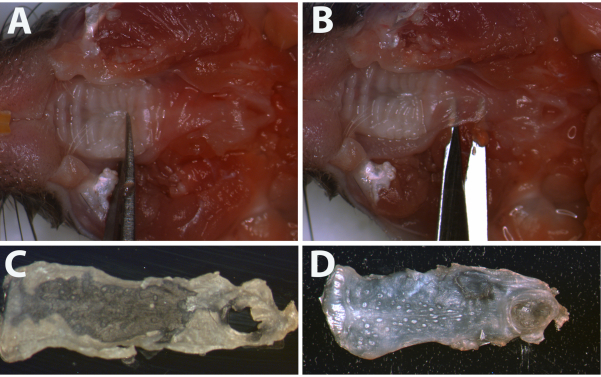
Figure 2: Dissection of palate for staining. (A) The palate was dissected first using thin blade scissors to cut the hard palate, (B) then using the same scissors to separate the soft palate from the underlying connective tissue. After removing the tissue from the oral cavity, any remaining tissue was removed with the scissors. At this point, all that may remain are glands on the back of the soft palate. A razorblade was used to gently scrape away these glands. The (C) back and (D) epithelial surface of the completed dissection of the palate are shown. Please click here to view a larger version of this figure.

Figure 3
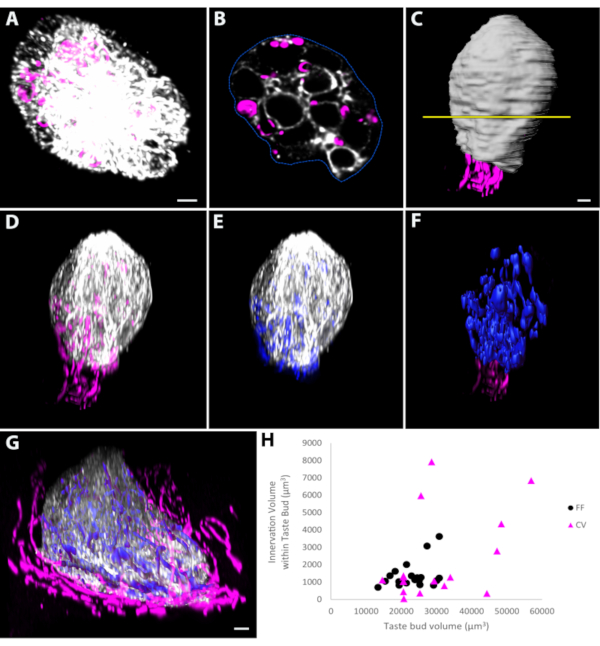
Figure 3: Measuring volume in whole-mount taste buds. (A) Whole-mount taste buds were imaged from the taste pore to the base of the taste bud so that the plane of highest resolution is the x-y plane. Each optical slice was viewed in pixel-based image analysis software, and the contour function was used to manually outline the periphery of the taste bud stained with keratin-8. (B) An example of one optical slice is provided. (C) The position of this representative section along the long axis of the taste bud is shown by the yellow line. After each optical section was outlined, a surface was created that represents the volume of the taste bud (white). Masking or duplicating the fluorescent channel corresponding to the taste bud (keratin-8 in D) or the tdTomato-labeled innervation (pseudo-colored blue in E) within the volume representing the taste bud. The fluorescence within the taste bud in (E) was used to generate a surface representing the volume of innervation within the taste bud (Fblue). (G) A similar approach was applied to whole-mount circumvallate taste buds imaged in the same orientation as the fungiform taste bud in A. (H) Measuring the volume of fungiform and circumvallate taste buds and their respective volume of innervation revealed that there is no correlation between the taste bud and innervation volume for taste buds sampled for either region. Scale bars in AD, F = 4 µm; scale bar in G = 5 µm. This figure has been modified from Ohman-Gault et al.50. Abbreviations: FF = fungiform; CV = circumvallate. Please click here to view a larger version of this figure.

Figure 4
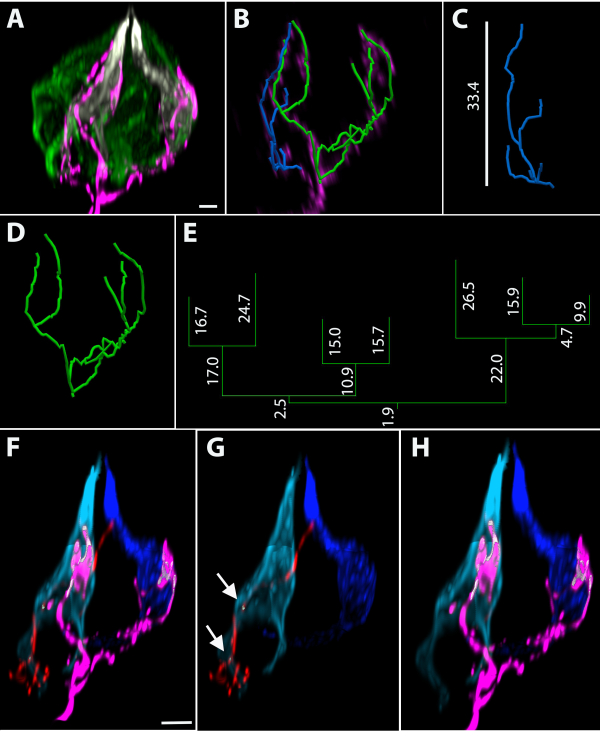
Figure 4: Representative terminal arbors in fungiform taste buds using sparse cell genetic labeling. (A) Whole-mount taste bud stained with taste-transducing-cell markers Car4 (white) and PLCβ2 (green). (B) This taste bud has two labeled terminal arbors, which are shown with the taste bud removed after reconstructing the fibers. (C) The blue arbor has 6 branch ends and an orthogonal height in the taste bud of 33.4 µm and (D) the green arbor has 7 branch ends. (E) The dendrogram corresponding to the green arbor is provided with each segment length in micrometers. (F-H) The distance between structures was measured. (FG) The blue tracing in C was segmented and is shown in red. (G) The areas where this terminal arbor is within 200 nm of the light blue Car4+ cell are indicated by white arrows. (F, H) The terminal arbor represented by the green reconstruction is shown in magenta. (H) The magenta arbor (associated with the green tracing in 4B, D) is within 200 nm of both the dark and light blue Car4+ cells. Scale bar in A, B = 4 µm; scale bars in FH = 5 µm. Please click here to view a larger version of this figure.

Figure 5
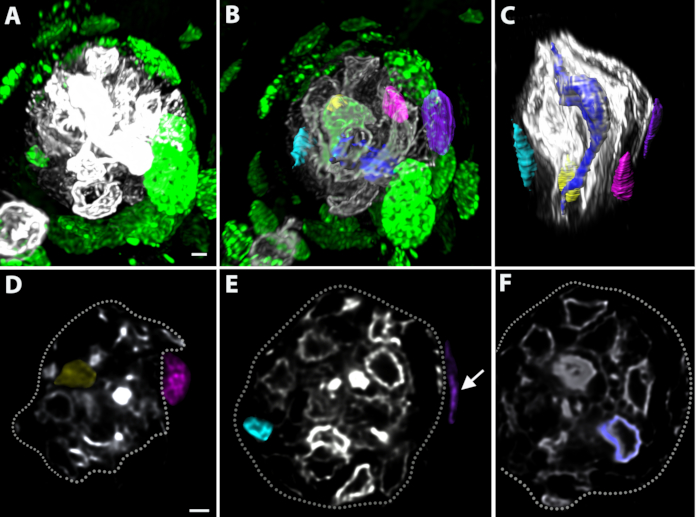
Figure 5: Whole-mounts can be used to track incorporation of new taste bud cells. Mice were injected with EdU to label dividing progenitors on Days 0, 1, and 3 and sacrificed on Day 4. (A, B) Cells labeled with EdU (green) can be identified both around and within the taste bud, which is labeled with keratin-8 (A, white, B, gray). (B, C) Individual EdU-labeled, keratin-8+ cells inside the taste bud and keratin-8-, EdU-labeled nuclei are segmented outside the taste bud. (DF) The fluorescence within each structure segmented in AB was masked and can be seen in cross-section. The perimeter of the taste bud is outlined with a white dotted line (DF). (D) The yellow cell is within the taste bud and is both EdU-labeled and keratin-8+. The magenta nucleus is outside the taste bud and is keratin-8-. (E) The teal cell is inside the taste bud and both EdU-labeled and keratin-8+. The purple EdU-labeled nucleus is keratin-8- and outside of the taste bud (white arrow). (F) The blue cell is keratin-8+ and elongated, consistent with mature taste-transducing cells. Scale bars in AC =3 µm; scale bars in D = 2 µm; scale bars in E, F = 4 µm. Abbreviation: EdU = 5-ethynyl-2′-deoxyuridine. Please click here to view a larger version of this figure.

Figure 6
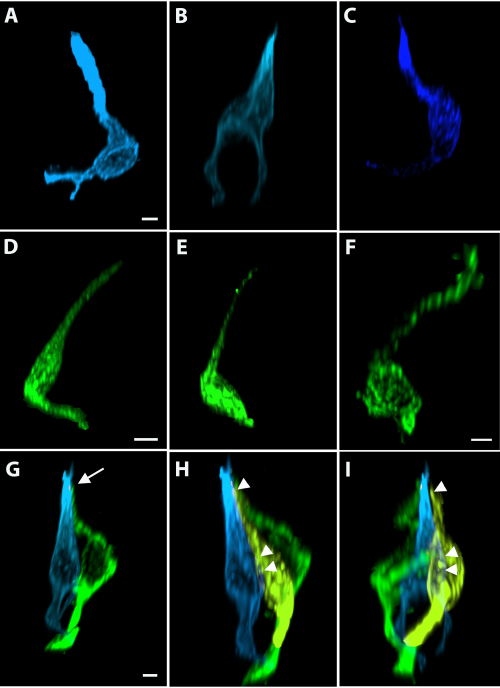
Figure 6: Shapes of whole taste bud cells can be analyzed along with their relationships with other taste bud cells. (AF). Segmenting individual taste bud cells to create surfaces isolates individual taste bud cells, facilitating clear visualization. Individual (AC) Car4+ and (DF) PLCβ2+ cells show the variation in individual cell shapes. (G) The closest PLCβ2+ cell to the Car4+ cell in B was determined to be within 200 nm (at a single small 0.5 µm2 location indicated by arrow). The next closest cell was greater than 300 nm away and distinguishable as a separate structure from the segmented Car4+ cell. (H, I) The next closest cell was segmented; and the masked fluorescence is shown in yellow. The three closest points for the next closest cell (yellow)are indicated by arrowheads in H, I. Scale bars in AC = 3 µm; scale bars in D, E = 4 µm; scale bar in F = 2 µm; scale bars in GI = 3 µm. Please click here to view a larger version of this figure.

Figure 7
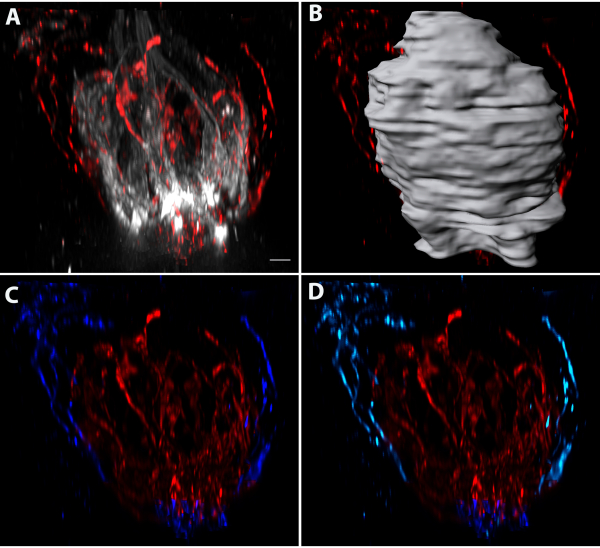
Figure 7: Quantifying innervation to the papilla. (A) Some labels for taste neurons also label innervation to the papilla.(B)The innervation within the taste bud is separated from the innervation outside the taste bud by segmenting the taste bud (as described for Figure 3), (C) masking the innervation inside the taste bud (red), and then masking the innervation outside of the taste bud only (dark blue). The volume of innervation to the taste bud (red) was 1649.6 μm3. The innervation outside the taste bud will include taste fibers underneath the papilla that should not be included in the quantification of the innervation to the papilla. (D) The fluorescence of the innervation to the papilla was masked (light blue). The volume of innervation to the papilla was 121.8 μm3. Scale bars in A-D = 4 μm. Please click here to view a larger version of this figure.

Discussion

The development of an approach to consistently collect and stain whole taste buds from three oral cavity taste regions (fungiform, circumvallate, and the palate) provides significant improvements for analyzing taste-transducing cells, tracking newly incorporated cells, innervation, and relationships between these structures. In addition, it facilitates the localization of a potential secondary neuron marker both within or outside of a labeled population50. This is particularly relevant given that gustatory papillae also receive robust somatosensory innervation52,53, which may also label some taste neurons. The papillae housing taste buds can also be imaged using a lower magnification. This permits visualization of the innervation to the entire papilla, as well as to the taste buds, and enables independent analyses of the innervation that penetrates the taste bud and the surrounding nerve fibers.

Somatosensory nerve endings in the skin can be distinguished based on their organization around hair follicles and their relationships to other components of the epithelium; parallel analyses in gustatory papillae may yield similar characterizations54,55. Establishing a normal foundation for the relationships within, and the composition of, taste buds and papillae will serve as a baseline for determining the mechanisms underlying deficits in peripheral taste functions56,57. The taste bud is a dynamic sensory end-organ where cell turnover and terminal arbor remodeling are coordinated by a variety of factors58. Investigations into the potential circuitry within the taste bud59, disease processes57, and chemotherapies that disrupt normal taste function58 could be enhanced by this method, which maintains whole taste buds and nerve fibers intact. The whole-mount method described here both expands the possibilities for analysis and refines the measurements that are possible.

Given that the tongue is a dense and heterogenous tissue, and that the taste bud itself contains many cell-to-cell junctions that limit permeability27, developing an approach to accomplish whole-mount staining of taste buds presented a significant challenge. Previous methods involved taking representative sections60 or cutting thicker sections, which then limited antibody penetration32,33,34. In addition, the selection of whole taste buds from these thicker sections biased the data toward smaller taste buds. Alternatively, peeling the epithelium is likely to disrupt taste bud nerve fibers; these are not specifically labeled when this approach is used39,40. Nerve arbors form a large plexus within a taste bud26,50,61, so it is unclear whether arbor removal disrupts the normal relationships between other cells in the taste bud. In contrast, the present whole-taste-bud method permits absolute numbers and measurements to be quantified. This staining permits many transducing-cell features (type, shape, and location) and the terminal arbors (as well as relationships between them) to be preserved and analyzed.

There are several limitations to this approach. In particular, some antibodies that have been used in thin sections62 do not work in whole-mounts, which will limit the types of structures that can be examined. In addition, as confocal microscopy resolution is limited, the structural data analyzed from individual cells, and from relationships between cells will also be limited24. For example, cells can be determined to be within 200 nm of each other, but specialized structures between cells (e.g., synapses)63 cannot be examined. Lastly, not all cell types can be labeled using this approach. For example, it has proven to be difficult to specifically label cells that transduce salt in this preparation. These cells could be a subset of a combination of Type 1, Type II, and Type III cells14,15,16,17,18,19,64. Type I cells, which are primarily supporting cells, cannot be examined in whole-mounts because they appear to wrap around other cells, making them difficult to distinguish as separate entities65. Having a reliable marker for salt-transducing cells would allow for more comprehensive analyses14,66. Likewise, as PLCβ2 staining represents taste cells capable of transducing multiple types of stimuli, a label that permitted further separation of this cell type would also be an improvement.

The following are important preparatory steps that require care. First, ensure that the muscle layer that remains after dissection is even and as thin as possible. If this layer is not even, antibody penetration will ultimately not be uniform. Second, it is crucial that the pieces of epithelium lay flat in the bottom of the tissue mold before freezing, and that blunt-ended forceps be used to lightly press on the tissue until it is frozen. When the minimal amount of muscle (in an even layer) remains on the underside of the epithelium, as few as three cryostat sections will reach the underside of the epithelium. Positioning of the tissue in a cryostat, so that sections are taken across the whole tissue face, sometimes results in portions of the tissue being removed unevenly. For these reasons, it is strongly recommended to avoid additional thawing, further dissection, and refreezing the tissue. Instead, care should be taken to evaluate tissue dissection before freezing the tissue.

Overall, the method for whole-mount tissue preparation presented here can be used for collecting whole taste buds as well as the surrounding papilla from three taste-bud regions: fungiform, circumvallate, and the palate. Although a variety of disease conditions56,57 and chemotherapies56 are known to disrupt taste function, the mechanisms underlying these changes remain unknown. Using the whole-mount staining approach for taste buds presented here represents a robust experimental design where both taste-transducing cells and their nerve fibers could be labeled to determine whether a deficit is due to loss of a specific cell type, compromised terminal arbor morphologies, disrupted relationships between taste-transducing cells, or disrupted relationships between transducing cells and their nerve fibers. Additionally, it would be possible not only to quantify the absolute number of labeled new cells in taste buds, but also to quantify the number of new taste-transducing cells (EdU-labeled) of a defined type (i.e., PLCβ2+ or Car4+). Whether these new cells develop normal shapes and incorporate normally into the taste bud (i.e., move into the taste bud following treatment) could also be examined. Many of these measures, along with taste bud number, can all be made from the same tissue, limiting the number of different animals needed for an experiment. These possibilities could facilitate the streamlining of experimental methods to provide clinical interventions for taste deficits, as well as provide insight into the normal mechanisms underlying taste function.

Disclosures

The authors have nothing to disclose.

Acknowledgements

We thank Kavisca Kuruparanantha for her contributions to tissue staining and the imaging of circumvallate taste buds, Jennifer Xu for staining and imaging of innervation to the papilla, Kaytee Horn for animal care and genotyping, and Liqun Ma for her tissue staining of the soft-palate taste buds. This project was supported by R21 DC014857 and R01 DC007176 to R.F.K and F31 DC017660 to L.O.

Materials

2,2,2-Tribromoethanol ACROS Organics AC421430100
2-Methylbutane ACROS 126470025
AffiniPure Fab Fragment Donkey Anti-Rabbit IgG Jackson ImmunoResearch 711-007-003 15.5μL/mL
Alexa Fluor® 647 AffiniPure Donkey Anti-Rat IgG Jackson Immuno Research 712-605-150 (1:500)
AutoQuant X3 software  Media Cybernetics
Blunt End Forceps Fine Science Tools  FST 91100-12
Click-iT™ Plus EdU Cell Proliferation Kit Molecular Probes C10637 Follow kit instructions 
Coverglass Marienfeld 107242
Cytokeratin-8 Developmental Studies Hybridoma Bank (DSHB), (RRID: AB_531826)  Troma1 supernatant (1:50, store at 4°C)
Dissection Scissors (coarse) Roboz RS-5619
Dissection Scissors (fine) Moria MC19B
Donkey anti-Rabbit IgG (H+L) Highly Cross-Adsorbed Secondary Antibody, Alexa Fluor 488 ThermoFisher Scientific A21206 (1:500)
Donkey anti-Rabbit, Alexa Fluor® 555 ThermoFisher Scientific A31572 (1:500)
DyLight™ 405 AffiniPure Fab Fragment Bovine Anti-Goat IgG Jackson Immuno Research 805-477-008 (1:500)
Fluoromount G Southern Biotech 0100-01
Glass slides Fisher Scientific (Superfrost Plus Miscroscope Slides) 12-550-15
Goat anti-Car4 R&D Systems  AF2414 (1:500)
Imaris  Bitplane  pixel-based image analysis software
Neurolucida 360 + Explorer MBF Biosciences 3D vector based image analysis software
Normal Donkey Serum Jackson Immuno Research 017-000-121
Normal Rabbit Serum  Equitech-Bio, Inc SR30
Olympus FV1000 (multi-Argon laser with wavelengths 458, 488, 515 and additional HeNe lasers emitting 543 and 633)
Paraformaldehyde EMD PX0055-3 4% in 0.1M PB
Rabbit anti-dsRed Living Colors DsRed Polyclonal Antibody; Clontech Clontech Laboratories, Inc. (632496) 632496 (1:500)
Rabbit anti-PLCβ2  Santa Cruz Biotechnology Cat# sc-206 (1:500)
Sodium Phosphate Dibasic Anhydrous Fisher Scientific BP332-500
Sodium Phosphate Monobasic Fisher Scientific BP330-500
tert-Amyl alcohol Aldrich Chemical Company 8.06193
Tissue Molds Electron Microscopy Sciences 70180
Tissue-Tek® O.C.T. Compound Sakura 4583
Triton X-100 BIO-RAD #161-0407
Zenon™ Alexa Fluor™ 555 Rabbit IgG Labeling Kit ThermoFisher Scientific Z25305 Follow kit instructions 

References

  1. Clapp, T. R., Medler, K. F., Damak, S., Margolskee, R. F., Kinnamon, S. C. Mouse taste cells with G protein-coupled taste receptors lack voltage-gated calcium channels and SNAP-25. BMC Biology. 4 (1), 7 (2006).
  2. Clapp, T. R., Yang, R., Stoick, C. L., Kinnamon, S. C., Kinnamon, J. C. Morphologic characterization of rat taste receptor cells that express components of the phospholipase C signaling pathway. The Journal of Comparative Neurology. 468 (3), 311-321 (2004).
  3. Delay, R. J., Roper, S. D., Kinnamon, J. C. Ultrastructure of mouse vallate taste buds: II. Cell types and cell lineage. The Journal of Comparative Neurology. 253 (2), 242-252 (1986).
  4. Finger, T. E. Cell types and lineages in taste buds. Chemical Senses. 30, 54-55 (2005).
  5. Kataoka, S., et al. The candidate sour taste receptor, PKD2L1, is expressed by type III taste cells in the mouse. Chemical Senses. 33 (3), 243-254 (2008).
  6. Murray, R. Fine structure of gustatory cells in rabbit taste buds. Journal of Ultrastructure Research. 27 (5-6), 444 (1969).
  7. Murray, R. G., Murray, A. Fine structure of taste buds of rabbit foliate papillae. Journal of Ultrastructure Research. 19 (3), 327-353 (1967).
  8. Yang, R., Crowley, H. H., Rock, M. E., Kinnamon, J. C. Taste cells with synapses in rat circumvallate papillae display SNAP-25-like immunoreactivity. The Journal of Comparative Neurology. 424 (2), 205-215 (2000).
  9. Yee, C. L., Yang, R., Böttger, B., Finger, T. E., Kinnamon, J. C. “Type III” cells of rat taste buds: Immunohistochemical and ultrastructural studies of neuron-specific enolase, protein gene product 9.5, and serotonin. Journal of Comparative Neurology. 440 (1), 97-108 (2001).
  10. Zhang, Y., et al. Coding of sweet, bitter, and umami tastes. Cell. 112 (3), 293-301 (2003).
  11. Chandrashekar, J., et al. The taste of carbonation. Science. 326 (5951), 443-445 (2009).
  12. Oka, Y., Butnaru, M., Von Buchholtz, L., Ryba, N. J. P., Zuker, C. S. High salt recruits aversive taste pathways. Nature. 494 (7438), 472-475 (2013).
  13. Stratford, J. M., Larson, E. D., Yang, R., Salcedo, E., Finger, T. E. 5-HT3A-driven green fluorescent protein delineates gustatory fibers innervating sour-responsive taste cells: A labeled line for sour taste. Journal of Comparative Neurology. 525 (10), 2358-2375 (2017).
  14. Baumer-Harrison, C., et al. Optogenetic stimulation of type I GAD65(+) cells in taste buds activates gustatory neurons and drives appetitive licking behavior in sodium-depleted mice. The Journal of Neuroscience. 40 (41), 7795-7810 (2020).
  15. Nomura, K., Nakanishi, M., Ishidate, F., Iwata, K., Taruno, A. All-electrical Ca(2+)-independent signal transduction mediates attractive sodium taste in taste buds. Neuron. 106 (5), 816-829 (2020).
  16. Ohmoto, M., Jyotaki, M., Foskett, J. K., Matsumoto, I. Sodium-taste cells require Skn-1a for generation and share molecular features with sweet, umami, and bitter taste cells. eneuro. 7 (6), (2020).
  17. Roebber, J. K., Roper, S. D., Chaudhari, N. The role of the anion in salt (NaCl) detection by mouse taste buds. The Journal of Neuroscience. 39 (32), 6224-6232 (2019).
  18. Oka, Y., Butnaru, M., von Buchholtz, L., Ryba, N. J., Zuker, C. S. High salt recruits aversive taste pathways. Nature. 494 (7438), 472-475 (2013).
  19. Lewandowski, B. C., Sukumaran, S. K., Margolskee, R. F., Bachmanov, A. A. Amiloride-insensitive salt taste is mediated by two populations of type III taste cells with distinct transduction mechanisms. The Journal of Neuroscience. 36 (6), 1942-1953 (2016).
  20. Beidler, L. M., Smallman, R. L. Renewal of cells within taste buds. The Journal of Cell Biology. 27 (2), 263-272 (1965).
  21. Hamamichi, R., Asano-Miyoshi, M., Emori, Y. Taste bud contains both short-lived and long-lived cell populations. Neuroscience. 141 (4), 2129-2138 (2006).
  22. Yarmolinsky, D. A., Zuker, C. S., Ryba, N. J. P. Common sense about taste: from mammals to insects. Cell. 139 (2), 234-244 (2009).
  23. Spector, A. C., Travers, S. P. The representation of taste quality in the mammalian nervous system. Behavoiral and Cognitive Neuroscience Reviews. 4 (3), 143-191 (2005).
  24. Huang, T., Ohman, L. C., Clements, A. V., Whiddon, Z. D., Krimm, R. F. Variable branching characteristics of peripheral taste neurons indicates differential convergence. bioRxiv. , (2020).
  25. Taruno, A., et al. CALHM1 ion channel mediates purinergic neurotransmission of sweet, bitter and umami tastes. Nature. 495 (7440), 223-226 (2013).
  26. Kinnamon, J. C., Taylor, B. J., Delay, R. J., Roper, S. D. Ultrastructure of mouse vallate taste buds. I. Taste cells and their associated synapses. The Journal of comparative neurology. 235 (1), 48-60 (1985).
  27. Dando, R., et al. A permeability barrier surrounds taste buds in lingual epithelia. American Journal of Physiology. Cell Physiology. 308 (1), 21-32 (2015).
  28. Mistretta, C. M. Permeability of tongue epithelium and its relation to taste. American Journal of Physiology. 220 (5), 1162-1167 (1971).
  29. Michlig, S., Damak, S., Le Coutre, J. Claudin-based permeability barriers in taste buds. The Journal of Comparative Neurology. 502 (6), 1003-1011 (2007).
  30. Kinnamon, S. C., Finger, T. E. Recent advances in taste transduction and signaling. F1000Research. 8, 2117 (2019).
  31. Meng, L., Huang, T., Sun, C., Hill, D. L., Krimm, R. BDNF is required for taste axon regeneration following unilateral chorda tympani nerve section. Experimental Neurology. 293, 27-42 (2017).
  32. Meng, L., Ohman-Gault, L., Ma, L., Krimm, R. F. Taste bud-derived BDNF is required to maintain normal amounts of innervation to adult taste buds. eneuro. 2 (6), (2015).
  33. Tang, T., Rios-Pilier, J., Krimm, R. Taste bud-derived BDNF maintains innervation of a subset of TrkB-expressing gustatory nerve fibers. Molecular and Cellular Neuroscience. 82, 195-203 (2017).
  34. Zhang, G. H., Zhang, H. Y., Deng, S. P., Qin, Y. M. Regional differences in taste bud distribution and -gustducin expression patterns in the mouse fungiform papilla. Chemical Senses. 33 (4), 357-362 (2008).
  35. Huang, T., Ma, L., Krimm, R. F. Postnatal reduction of BDNF regulates the developmental remodeling of taste bud innervation. Developmental Biology. 405 (2), 225-236 (2015).
  36. Nosrat, I. V., Margolskee, R. F., Nosrat, C. A. Targeted taste cell-specific overexpression of brain-derived neurotrophic factor in adult taste buds elevates phosphorylated TrkB protein levels in taste cells, increases taste bud size, and promotes gustatory innervation. Journal of Biological Chemistry. 287 (20), 16791-16800 (2012).
  37. Liebl, D. J., Mbiene, J. -. P., Parada, L. F. NT4/5 mutant mice have deficiency in gustatory papillae and taste bud formation. Developmental Biology. 213 (2), 378-389 (1999).
  38. Kumari, A., Yokota, Y., Li, L., Bradley, R. M., Mistretta, C. M. Species generalization and differences in Hedgehog pathway regulation of fungiform and circumvallate papilla taste function and somatosensation demonstrated with sonidegib. Scientific Reports. 8 (1), (2018).
  39. Venkatesan, N., Boggs, K., Liu, H. X. Taste bud labeling in whole tongue epithelial sheet in adult mice. Tissue Engineering. Part C, Methods. 22 (4), 332-337 (2016).
  40. Meisel, C. T., Pagella, P., Porcheri, C., Mitsiadis, T. A. Three-dimensional imaging and gene expression analysis upon enzymatic isolation of the tongue epithelium. Frontiers in Physiology. 11, 825 (2020).
  41. Schmitz, C., Hof, P. R. Design-based stereology in neuroscience. Neuroscience. 130 (4), 813-831 (2005).
  42. Guagliardo, N. A., Hill, D. L. Fungiform taste bud degeneration in C57BL/6J mice following chorda-lingual nerve transection. The Journal of Comparative Neurology. 504 (2), 206-216 (2007).
  43. Ohtubo, Y., Yoshii, K. Quantitative analysis of taste bud cell numbers in fungiform and soft palate taste buds of mice. Brain Research. 1367, 13-21 (2011).
  44. Ogata, T., Ohtubo, Y. Quantitative analysis of taste bud cell numbers in the circumvallate and foliate taste buds of mice. Chemical Senses. 45 (4), 261-273 (2020).
  45. Tomchik, S. M., Berg, S., Kim, J. W., Chaudhari, N., Roper, S. D. Breadth of tuning and taste coding in mammalian taste buds. Journal of Neuroscience. 27 (40), 10840-10848 (2007).
  46. Finger, T. E. ATP signaling is crucial for communication from taste buds to gustatory nerves. Science. 310 (5753), 1495-1499 (2005).
  47. Lau, J., et al. Temporal control of gene deletion in sensory ganglia using a tamoxifen-inducible Advillin-CreERT2 recombinase mouse. Molecular Pain. 7 (1), 100 (2011).
  48. Hirsch, M. -. R., D’Autréaux, F., Dymecki, S. M., Brunet, J. -. F., Goridis, C. APhox2b::FLPotransgenic mouse line suitable for intersectional genetics. genesis. 51 (7), 506-514 (2013).
  49. Perea-Martinez, I., Nagai, T., Chaudhari, N. Functional cell types in taste buds have distinct longevities. PLoS ONE. 8 (1), 53399 (2013).
  50. Ohman-Gault, L., Huang, T., Krimm, R. The transcription factor Phox2b distinguishes between oral and non-oral sensory neurons in the geniculate ganglion. Journal of Comparative Neurology. 525 (18), 3935-3950 (2017).
  51. Dvoryanchikov, G., et al. Transcriptomes and neurotransmitter profiles of classes of gustatory and somatosensory neurons in the geniculate ganglion. Nature Communications. 8 (1), (2017).
  52. Whitehead, M. C., Ganchrow, J. R., Ganchrow, D., Yao, B. Organization of geniculate and trigeminal ganglion cells innervating single fungiform taste papillae: a study with tetramethylrhodamine dextran amine labeling. Neuroscience. 93 (3), 931-941 (1999).
  53. Suemune, S., et al. Trigeminal nerve endings of lingual mucosa and musculature of the rat. Brain Research. 586 (1), 162-165 (1992).
  54. Rutlin, M., et al. The cellular and molecular basis of direction selectivity of Aδ-LTMRs. Cell. 159 (7), 1640-1651 (2014).
  55. Abraira, V. E., Ginty, D. D. The sensory neurons of touch. Neuron. 79 (4), 618-639 (2013).
  56. Feng, P., Huang, L., Wang, H. Taste bud homeostasis in health, disease, and aging. Chemical Senses. 39 (1), 3-16 (2014).
  57. Cooper, K. W., et al. COVID-19 and the chemical senses: supporting players take center stage. Neuron. 107 (2), 219-233 (2020).
  58. Barlow, L. A. Progress and renewal in gustation: new insights into taste bud development. Development. 142 (21), 3620-3629 (2015).
  59. Roper, S. D. Taste buds as peripheral chemosensory processors. Seminars in Cell & Developmental Biology. 24 (1), 71-79 (2013).
  60. Ma, H., Yang, R., Thomas, S. M., Kinnamon, J. C. BMC. Neuroscience. 8 (1), 5 (2007).
  61. Kinnamon, J. C., Sherman, T. A., Roper, S. D. Ultrastructure of mouse vallate taste buds: III. Patterns of synaptic connectivity. The Journal of Comparative Neurology. 270 (1), 1-10 (1988).
  62. Romanov, R. A., et al. Chemical synapses without synaptic vesicles: Purinergic neurotransmission through a CALHM1 channel-mitochondrial signaling complex. Science Signaling. 11 (529), 1815 (2018).
  63. Dani, A., Huang, B., Bergan, J., Dulac, C., Zhuang, X. Superresolution imaging of chemical synapses in the brain. Neuron. 68 (5), 843-856 (2010).
  64. Vandenbeuch, A., Clapp, T. R., Kinnamon, S. C. Amiloride-sensitive channels in type I fungiform taste cells in mouse. BMC Neuroscience. 9 (1), 1 (2008).
  65. Bartel, D. L., Sullivan, S. L., Lavoie, &. #. 2. 0. 1. ;. G., Sévigny, J., Finger, T. E. Nucleoside triphosphate diphosphohydrolase-2 is the ecto-ATPase of type I cells in taste buds. The Journal of Comparative Neurology. 497 (1), 1-12 (2006).
  66. Wilson, C. E., Vandenbeuch, A., Kinnamon, S. C. Physiological and behavioral responses to optogenetic stimulation of PKD2L1+ type III taste cells. eneuro. 6 (2), (2019).
check_url/62126?article_type=t

Play Video

Cite This Article
Ohman, L. C., Krimm, R. F. Whole-Mount Staining, Visualization, and Analysis of Fungiform, Circumvallate, and Palate Taste Buds. J. Vis. Exp. (168), e62126, doi:10.3791/62126 (2021).

View Video