This protocol describes a method for the synchronous acquisition and co-registration of intracellular signaling events and the secretion of insulin and glucagon by primary human pseudoislets using the adenoviral delivery of a cyclic adenosine monophosphate (cAMP) biosensor, a cAMP difference detector in situ (cADDis), and a microperifusion system.
The pancreatic islets of Langerhans, which are small 3D collections of specialized endocrine and supporting cells interspersed throughout the pancreas, have a central role in the control of glucose homeostasis through the secretion of insulin by beta cells, which lowers blood glucose, and glucagon by alpha cells, which raises blood glucose. Intracellular signaling pathways, including those mediated by cAMP, are key for regulated alpha and beta cell hormone secretion. The 3D islet structure, while essential for coordinated islet function, presents experimental challenges for mechanistic studies of the intracellular signaling pathways in primary human islet cells. To overcome these challenges and limitations, this protocol describes an integrated live-cell imaging and microfluidic platform using primary human pseudoislets generated from donors without diabetes that resemble native islets in their morphology, composition, and function. These pseudoislets are size-controlled through the dispersion and reaggregation process of primary human islet cells. In the dispersed state, islet cell gene expression can be manipulated; for example, biosensors such as the genetically encoded cAMP biosensor, cADDis, can be introduced. Once formed, pseudoislets expressing a genetically encoded biosensor, in combination with confocal microscopy and a microperifusion platform, allow for the synchronous assessment of fluorescent biosensor dynamics and alpha and beta cell hormone secretory profiles to provide more insight into cellular processes and function.
The islets of Langerhans are mini organs scattered throughout the pancreas whose function is crucial for the maintenance of glucose homeostasis. Insulin is secreted from beta cells following the metabolism of glucose, an increase in the ATP/ADP ratio, the closure of ATP-sensitive potassium channels, depolarization of the plasma membrane, and the influx of extracellular calcium1. Glucagon secretion from alpha cells is less understood, but it has been postulated that intracellular and paracrine pathways contribute to glucagon granule exocytosis2,3,4. Both type 1 and type 2 diabetes are associated with islet cell dysfunction5,6,7. Therefore, elucidating the intracellular signaling pathways mediating islet hormone secretion is essential for understanding physiologic and pathologic mechanisms in pancreatic islets.
The spherical architecture of islets presents certain obstacles to experimentation. These challenges include islet size variation and the 3D nature of islets, which reduces viral transduction within the islet core8,9. To overcome these challenges, a pseudoislet system was developed, in which primary human islets are dispersed into single cells, adenovirally transduced with constructs encoding targets of interest, and reaggregated to form size-controlled, islet-like structures termed pseudoislets7. Compared to native islets from the same donor that have been cultured in parallel, these pseudoislets are similar in morphology, endocrine cell composition, and hormone secretion7. This method allows for the expression of constructs throughout the pseudoislet, meaning it overcomes a previous barrier to the uniform genetic manipulation of primary human islets7,8,9.
In this protocol, the pseudoislet system is integrated with a microfluidic device to express biosensors in primary human islet cells and gain temporal resolution of pseudoislet hormone secretion during dynamic perifusion10,11,12. The pseudoislets are placed in a microchip and exposed to a steady flow of different secretagogues via a peristaltic pump12. The microchip has a transparent glass bottom and is mounted on a confocal microscope to record the intracellular signaling dynamics via changes in the biosensor fluorescence intensity. Biosensor imaging is synchronized with the collection of microperifusion effluent for the subsequent analysis of insulin and glucagon secretion7. Compared to macroperifusion, this microperifusion approach allows for fewer pseudoislets to be used due to the smaller volume of the microfluidic device compared to the macroperifusion chamber7.
To harness the utility of this system, the cyclic adenosine monophosphate (cAMP) difference detector in situ (cADDis) biosensor was expressed in human pseudoislets to assess cAMP dynamics and hormone secretion. The cADDis biosensor is composed of a circularly permuted green fluorescent protein (cpGFP) positioned in the hinge region of an exchange protein activated by cAMP 2 (EPAC2), connecting its regulatory and catalytic regions. The binding of cAMP to the regulatory region of EPAC2 elicits a conformational change in the hinge region that increases fluorescence from the cpGFP13. Intracellular messengers such as cAMP elicit insulin and glucagon secretion after the upstream activation of G-protein coupled receptors14. Live-cell imaging coupled with microperifusion helps to connect the intracellular cAMP dynamics with islet hormone secretion. Specifically, in this protocol, cADDis-expressing pseudoislets are generated to monitor cAMP responses in alpha and beta cells to various stimuli: low glucose (2 mM glucose; G 2), high glucose plus isobutylmethylxanthine (IBMX; 20 mM glucose + 100 µM IBMX; G 20 + IBMX), and low glucose plus epinephrine (Epi; 2 mM glucose + 1 µM Epi; G 2 + Epi). This treatment workflow allows for the assessment of the intracellular cAMP dynamics directly via 1) IBMX-mediated phosphodiesterase inhibition, which enhances intracellular cAMP levels by preventing its degradation, and 2) epinephrine, a known cAMP-dependent stimulator of alpha cell glucagon secretion mediated by β-adrenergic receptor activation. The steps for setting up the microperifusion apparatus for live-cell imaging experiments, the loading of the pseudoislets into the microchip, synchronous live-cell imaging and microperifusion, and the analysis of the biosensor traces and hormone secretion by microplate-based hormone assays are detailed below.
Human islets (N = 4 preparations) were obtained through partnerships with the Integrated Islet Distribution Program, Human Pancreas Analysis Program, Prodo Laboratories, Inc., and Imagine Pharma. The Vanderbilt University Institutional Review Board does not consider deidentified human pancreatic specimens as human subjects research. This work would not be possible without organ donors, their families, and organ procurement organizations. See Table 1 for donor demographic information. Human islets from pancreas donors without diabetes were isolated with less than 15 h of cold ischemia time.
1. Pseudoislet formation (detailed in Walker et al.7)
2. Preparation for live-cell imaging and microperifusion (1 day prior to the experiment)
NOTE: Information on the microperifusion medium preparation is available through the protocols.io resource (https://www.protocols.io/view/analysis-of-islet-function-in-dynamic-cell-perifus-bt9knr4w.html).
3. Addition of secretagogues to the DMEM (day of the experiment)
4. Microperifusion apparatus setup
5. Loading of the pseudoislets into the microchip
6. Synchronous live-cell imaging and microperifusion
7. Pseudoislet acid ethanol extraction
8. Additional experiments and clean-up
9. Data analysis
NOTE: Live-cell imaging was performed using a laser-scanning confocal microscope. The images were analyzed using the microscope-associated imaging software package. The following are general guidelines but may differ depending on the microscope manufacturer and image acquisition software.
Biosensor-expressing human pseudoislets were created via the adenoviral delivery of constructs encoding the cAMP biosensor cADDis (Figure 1A). Figure 1B shows the reaggregation of the transduced human islet cells over time, with fully formed pseudoislets observed after 6 days of culture. The cells began to show visible cADDis fluorescence within 48 h, and there was high biosensor expression in transduced cells by the end of the culture period. Using this protocol, the pseudoislets displayed an average transduction efficiency of 60% in alpha cells and 95% in beta cells (Figure 1C–D).
The integrated microfluidic and live-cell imaging platform is highlighted in Figure 2. After harvesting the cADDis-expressing pseudoislets and allowing them to incubate in fresh medium overnight, the pseudoislets were loaded into the center of a pre-wetted well on a microchip. The microchip was then clamped in a holder and placed on a microscope stage. Inside the environmental chamber attached to the microscope, which was maintained at 37 °C, the pseudoislets were perifused with media containing alpha and beta cell secretagogues, which were pumped through a de-bubbler to prevent the introduction of air bubbles into the system. The pseudoislets in the microchip were perifused at a flow rate of 100 µL/min, and the effluent was collected at 2 min intervals via a fraction collector (Figure 2A–B). The glass bottom of the microchip well allows for capturing the cADDis fluorescence intensity of multiple pseudoislets in a field of view, which is essential for later analysis (Figure 2C).
Figure 3 shows representative results using the described protocol with cADDis-expressing pseudoislets generated from native islets isolated from three human donors without diabetes. The cADDis-expressing pseudoislets were perifused with 2 mM glucose (G 2), 20 mM glucose plus the phosphodiesterase inhibitor isobutylmethylxanthine (IBMX; G 20 + IBMX), and 2 mM glucose plus epinephrine (G 2 + Epi). This protocol elicits known intracellular pathways that enhance cAMP within alpha and beta cells (Figure 3A–B). The microperifusion setup facilitates the synchronous collection of the intracellular cAMP dynamics through cADDis fluorescence and hormone secretion (Figure 3C–E). To ensure experimental rigor, experiments on the pseudoislets were performed from the same donor with two to three replicates, and the aggregate values are plotted in Figure 3C–E,D',E'. With exposure to G 2, the relative cADDis intensity was low and stable, as was the insulin secretion (Figure 3C–D). When the pseudoislets were exposed to G 20 + IBMX, there was a robust increase in the intracellular cAMP concentration, as evidenced by an increase in the relative cADDis intensity (Figure 3C). This increase was most likely due to both beta and alpha cells, as demonstrated by the concomitant marked increases in both insulin and glucagon secretion (Figure 3D–E). The exposure of the pseudoislets to G 2 + Epi increased the intracellular cAMP concentration (Figure 3C), and this was associated with an increase in glucagon secretion (Figure 3E). The observation that the cAMP response to G 2 + Epi was relatively smaller compared to the IBMX response may have occurred due to a combination of the lower transduction efficiency of the cADDis adenoviral construct in alpha cells versus beta cells (Figure 1D) and the alpha cell-specificity of this signal (Figure 3E). Therefore, based on known cAMP-mediated signaling pathways in primary human beta and alpha cells, this protocol successfully demonstrates the utility of this integrated platform to simultaneously examine the relative fluorescence intensity of the cADDis biosensor and beta and alpha cell hormone secretory profiles across technical and biological replicates.
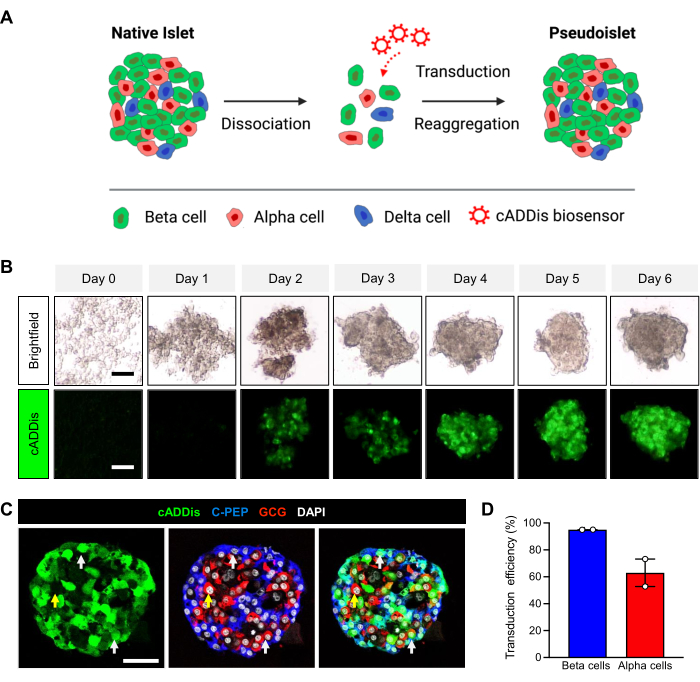
Figure 1: Formation of biosensor-expressing human pseudoislets. (A) Schematic showing primary human islet dissociation, transduction with the biosensor construct in a single-cell state, and reaggregation. Following reaggregation, the pseudoislets are harvested and undergo synchronous live-cell imaging and microperifusion. The protocol steps are indicated throughout the schematic. (B) Representative images capturing the formation of a cADDis-expressing pseudoislet during a 6 day reaggregation period; top: brightfield with contrast, bottom: cADDis fluorescence. The scale bar is 100 µm. (C) Representative images of a cADDis-expressing pseudoislet (green) with alpha and beta cells visualized by C-peptide (CPEP, blue) and glucagon (GCG, red) labeling, respectively. DAPI (white) was used as a nuclear counterstain. The white arrows highlight the transduced alpha and beta cells. The yellow arrow points to an untransduced alpha cell. The scale bar is 100 µm. (D) Quantification of the transduction efficiency at MOI 1,000 in beta and alpha cells by a HALO cytonuclear algorithm (N = 2 donors, with an average of 601 beta cells and 627 alpha cells analyzed per donor across multiple pseudoislets). The error bars indicate the standard error of the mean. Please click here to view a larger version of this figure.
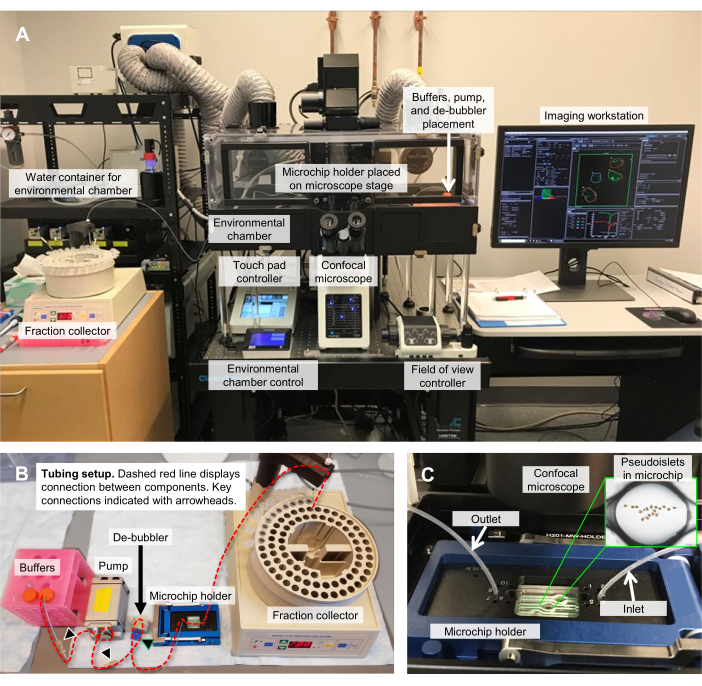
Figure 2: Integrated live-cell imaging and microperifusion system. (A) Overview of the live-cell imaging and microperifusion system components. The pseudoislets in a microchip are placed on the stage of a confocal laser-scanning microscope enclosed within an environmental chamber. This configuration allows for temporal resolution regarding the intracellular changes in biosensor fluorescence during the dynamic response to a series of well-defined secretagogues and the collection of pseudoislet perifusate fractions for the synchronous measurement of the hormone secretion for further integration with intracellular signaling events. (B) The components of the microfluidic platform outside of the environmental chamber. The fluid directionality is as follows: (1) secretagogue-containing tubes to (2) 0.01 in tubing to (3) peristaltic pump tubing (0.02 in inner diameter) to (4) 0.01 in tubing to (5) de-bubbler to (6) microchip inlet (0.01 in tubing) to (7) microchip holder/microchip to (8) microchip outlet (0.01 in tubing). Note: The 0.01 in tubing is joined to the peristaltic pump tubing with conical adapters (white arrowheads). The tubing is plugged into the de-bubbler via a nut and ferrule (green arrowhead). The dashed red line displays the connectivity between the components. (C) Close-up view of the microchip and holder within the environmental chamber mounted on the confocal microscope stage. Please click here to view a larger version of this figure.
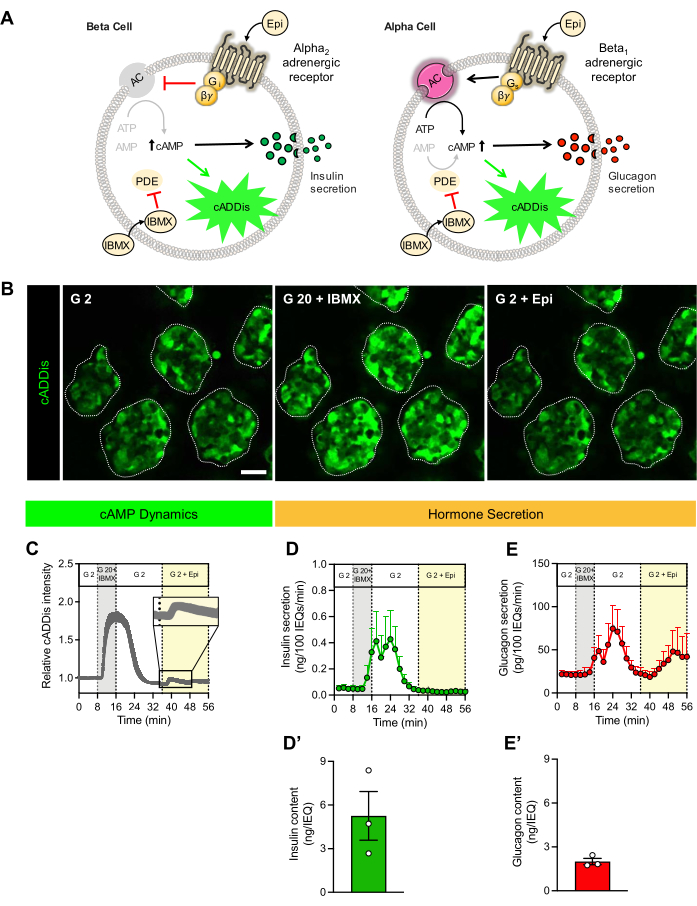
Figure 3: Human pseudoislet cAMP and hormone secretion dynamics. (A) Schematics of secretagogue-induced cADDis fluorescence and hormone secretion in beta and alpha cells. In beta cells, epinephrine (Epi) binds Gi-coupled alpha2-adrenergic receptors, which leads to the inhibition of adenylyl cyclase (AC), decreased cAMP, and reduced insulin secretion. In alpha cells, Epi stimulates Gs-coupled beta1-adrenergic receptors, leading to the activation of AC and an increase in intracellular cAMP. In both cell types, IBMX, a phosphodiesterase (PDE) inhibitor, prevents the degradation of intracellular cAMP and promotes hormone secretion. The binding of free intracellular cAMP causes conformational changes in the cADDis protein, thus causing an increase in fluorescence intensity. (B) Representative images of cADDis-expressing pseudoislets during live-cell imaging in response to G 2 (2 mM glucose), G 20 + IBMX (20 mM glucose + IBMX), and G 2 + Epi (2 mM glucose + Epi). The pseudoislets are outlined in white, and the secretagogue type is indicated in the top-left corner. The scale bar is 50 µm. (C) Relative cADDis fluorescence over time averaged across cADDis-expressing pseudoislets made from human islets from three organ donor preparations. (D) Aggregate insulin and (E) glucagon secretion in response to the indicated secretagogues. The data are normalized to the islet volume, expressed in islet equivalents (IEQs). The pseudoislets were prepared from three human islet donors and analyzed using two to three technical replicates/donor. The islet cells were transduced with cADDis adenoviral construct at MOI 500 (N = 1) or 1,000 (N = 2). (D',E') The pseudoislet hormone content. The error bars indicate the standard error of the mean. Please click here to view a larger version of this figure.
Table 1: Donor demographics. Summary of donor demographic information for the human islets used during the preparation of the pseudoislets with cADDis biosensor expression and live-cell imaging. Please click here to download this Table.
Table 2: Troubleshooting guide. Challenges that may be encountered are highlighted, including a list of common causes of issues, solutions, and prevention techniques. Please click here to download this Table.
Table 3: Microperifusion protocol. An example microperifusion protocol used for the experiments highlighted in the representative results. This protocol is specifically geared toward the co-registration of intracellular cAMP and islet hormone secretion; alternate protocols may be more appropriate depending on the intracellular molecule of interest and/or the chosen biosensor dynamics. Please click here to download this Table.
Supplementary File 1: The calculation of islet equivalents (IEQ). An example of how to calculate the IEQ for the pseudoislets used in each experiment. The data in Sheet 1 (1. Object Measurements) include object data exported directly from the software (see step 9.1). The green highlighted column is inserted to count the number of pseudoislets that fall within each index in step 9.1.6.2. The counts are copied to Sheet 2 (2. IEQ Calculation) and converted to the IEQ using the appropriate conversion factor per index. Any pseudoislet loss during chip loading (In-chip pseudoislet #) and prior to the removal of extracts (Post-run pseudoislet #) can be accounted for using the images captured during these phases (see step 5.5 and step 7.1.1, respectively). Please click here to download this File.
Supplementary File 2: Data analysis. An example of how to calculate the relative cADDis intensity from the data obtained in step 9.2. The raw data in columns D-F is exported directly from the software. The raw values at each time point are normalized to the average intensity in the last minute of baseline medium (G 2; 7-8 min in the protocol). The average intensity across all the pseudoislets over time is calculated to generate the graph in Figure 2C. Please click here to download this File.
The integration of a microperifusion system, biosensor-expressing pseudoislets, and laser-scanning confocal microscopy allows for the synchronous assessment of intracellular signaling events and dynamic hormone secretory profiles. The dynamic microperifusion system can deliver a series of well-defined stimuli to the pseudoislets and allows for the collection of the effluent, in which the insulin and glucagon concentrations can be measured by commercially available ELISA. Concurrently, live-cell imaging of the biosensor-expressing pseudoislets by a confocal microscopy platform captures the real-time biosensor fluorescence activity, which provides information about intracellular signaling events. The simultaneous measurement of the biosensor signal and hormone secretory profile over time provides the opportunity to directly compare the influence of intracellular signaling events on islet hormone secretion.
Multiple considerations are key to the success of the presented protocol. These include generating biosensor-expressing pseudoislets and using a constant flow rate during each experiment without pseudoislet movement. At a flow rate of 100 µL/min and with 2 min of fraction collection, the perifusate volume of each fraction is 200 µL and should not fluctuate by more than 10 µL/fraction. In addition, while the imaging software can adjust to minor pseudoislet movement in the XY plane within the field of view, pseudoislets that move out of the field of view in the course of the microperifusion experiment cannot be analyzed. Thus, it is important to detect any leaks and movement early on during the experiment such that attempts can be made to fix the issue. A summary of the potential challenges, their common causes, solutions, and tips to prevent them from occurring are summarized in Table 2. Nevertheless, this protocol includes multiple opportunities to anticipate issues, such as performing a test experiment prior to loading the chip (step 2.3) and monitoring the pseudoislets for significant movement via a microscope during the 30 min wash period prior to image acquisition and microperifusion fraction collection (steps 6.4-6.5).
One limitation is that the field of view on the current confocal microscopy platform does not allow all the pseudoislets within the microchip to be captured at once. While a minimum of 30 pseudoislets are required to reliably detect insulin and glucagon in the microperifusates, only a subset can be imaged at 20x magnification. Loading the pseudoislets into the center of the well maximizes the number that can be captured in the field of view. In addition, while the microchip is equipped with three wells, the integration with confocal microscopy limits the measurements to one well at a time, meaning that technical replicates must be done in series rather than in parallel. Furthermore, this current approach co-registers the whole pseudoislet fluorescence with alpha and beta cell-specific secretory outputs; however, this could be modified to directly measure changes in alpha or beta cell intracellular events using the cell-specific targeting of genetically encoded biosensors. While only insulin and glucagon secretion were assessed in this protocol, future studies could also measure the secretion of other islet hormones, such as somatostatin secretion from delta cells. Of note, at this time, somatostatin is only detectable with this platform in response to highly stimulatory secretagogues such as IBMX. Lastly, isolated islets and pseudoislets lack the neurovascular architecture of islets in vivo, which has been shown to directly impact the islet function.
In conclusion, the described platform provides a strategy to synchronize the assessment of intracellular signaling events using biosensor and hormone secretion. This system can be further adapted to examine the functional perturbations introduced by RNA interference (siRNA or shRNA) or CRISPR-mediated gene targeting strategies. These methods can be used to determine the biological effects of pathways of interest on a multitude of intracellular or extracellular events using genetically encoded biosensors outside of cADDis, as has been previously demonstrated for GCaMP6f7. Additionally, the selective transduction of a particular cell type and/or exposure to cell-specific stimuli would allow for the targeted interrogation of intracellular signaling events of a specific cell type within the context of the human islet. For example, alpha cells of human pancreatic islets could be purified using cell surface markers and subsequently transduced with the commonly used genetically encoded calcium biosensor GCaMP to assess the intracellular calcium dynamics. These virally transduced cells could be then recombined with other untransduced islet cells to form pseudoislets or left to reaggregate on their own to generate alpha cell-enriched pseudoislets that compositionally resemble islets in type 1 diabetes. This approach is different from more conventional techniques, in which intracellular molecules such as Ca2+ are measured using loaded Ca2+-sensitive dyes and the cell identity is determined after live-cell imaging by immunostaining or other means15. Alternatively, measurements are done in the single-cell state, where the impact of paracrine signaling on the islet cell function is lost15. Thus, this live-cell imaging integrated with a pseudoislet system and microperifusion platform overcomes previous challenges in islet biology while broadening the knowledge of integral cellular processes.
The authors have nothing to disclose.
Organ donors and their families are appreciated for their invaluable donations, and the International Institute for Organ Procurement Organizations, Advancement of Medicine (IIAM) and the National Disease Research Exchange (NDRI) are acknowledged for their partnership in making human pancreatic tissue accessible for research. This work was supported by the Human Islet Research Network (RRID:SCR_014393), the Human Pancreas Analysis Program (RRID:SCR_016202), DK106755, DK123716, DK123743, DK120456, DK104211, DK108120, DK112232, DK117147, DK112217, EY032442, and DK20593 (Vanderbilt Diabetes Research and Training Center), The Leona M. and Harry B. Helmsley Charitable Trust, JDRF, the U.S. Department of Veterans Affairs (BX000666), the NIGMS of the National Institutes of Health (T32GM007347), F30DK134041, F30DK118830, and the National Science Foundation Graduate Research Fellowship (1937963).
Ad-CMV-cADDis | Welgen | Not applicable | |
0.01” FEP tubing | IDEX | 1527L | |
1 M HEPES | Gibco | 15630-080 | Enriched-CMRL Media Component |
1.5 mL and conical tubes | Any | Any | |
10 μm PTFE filter | Cole-Parmer | SK-21940-41 | Change every 8-10 runs |
100 mM Sodium Pyruvate | Thermo Scientific | 11360070 | Enriched-CMRL Media Component |
190 proof Ethanol | Decon labs | 2816 | Acid Ethanol Component |
200 mM GlutaMAX-I Supplement | Gibco | 35050061 | Enriched-CMRL Media Component |
Ascorbate | Sigma | A5960 | DMEM Perifusion Buffer Component |
Bovine Serum Albumin | Sigma | A7888 | DMEM Perifusion Buffer Component |
Bubble trap | Omnifit | 006BT | |
CellCarrier ULA 96-well Microplates | Perkin Elmer | 6055330 | |
cellSens analysis software | Olympus | v3.1 | Software used for data analysis |
CMRL 1066 | MediaTech | 15-110-CV | Enriched-CMRL Media Component |
Conical adapter (IDEX, P-794) | IDEX | P-794 | |
D-(+)-Glucose | Sigma | G7528 | Glucose Buffer Component |
DMEM | Sigma | D5030 | DMEM Perifusion Buffer Component |
Environmental chamber | okolab | IX83 | |
Epinepherine (Epi) | Sigma | E4250 | Stimulation Buffer Component |
Fetal Bovine Serum (FBS), Heat Inactivated | Sigma | 12306C | Enriched-CMRL Media Component |
Glucagon ELISA | Mercodia | 10-1281-01 | |
Glucagon Kit HTRF | Cisbio | 62CGLPEH | |
HCl (12N) | Any | Any | Acid Ethanol Component |
HEPES | Sigma | H7523 | DMEM Perifusion Buffer Component |
iCell Endothelial Cells Medium Supplement | Cell Dynamics | M1019 | iEC Media Component |
Idex Derlin nut & ferrule 1/4-24 | Cole-Parmer | EW-00414-LW | |
Insulin ELISA | Mercodia | 10-1113-01 | |
Isobutylmethylonine (IBMX) | Sigma | I5879 | Stimulation Buffer Component |
Laser scanning confocal microscope | Olympus | FV3000 | |
L-Glutamine | Sigma | G8540 | DMEM Perifusion Buffer Component |
Microchip (University of Miami, FP-3W) | University of Miami | FP-3W | |
Microchip holder | Micronit Microfluidics | FC_PRO_CH4525 | |
Model 2110 Fraction Collector | Biorad | 7318122 | |
P10, P200, and P1000 pipets and tips | Any | Any | |
Penicillin/Streptomycin | Gibco | 15140-122 | Enriched-CMRL Media Component |
Peristaltic pump | Instech | P720 | |
Phosphate Buffered Saline | Gibco | 14190-144 | Wash Islets |
Sarstedt dishes | Sarstedt | depends on dish diameter | |
Sodium Bicarbonate | Sigma | S6014 | DMEM Perifusion Buffer Component |
Sodium Pyruvate | Sigma | P2256 | DMEM Perifusion Buffer Component |
Stereoscope | Olympus | SZX12 | |
Steriflip Filter (0.22 μm) | Millipore | SCGP00525 | Filter all buffers twice |
VascuLife VEGF Medium Complete Kit | LifeLine Cell Technology | LL-0003 | iEC Media Component |