JoVE Science Education
Microbiology
A subscription to JoVE is required to view this content.  Sign in or start your free trial.
JoVE Science Education Microbiology
Plaque Assay: A Method to Determine Viral Titer as Plaque Forming Units (PFU)
  • 00:01Concepts
  • 03:09Media Preparation
  • 05:12Preparing Agar Plates
  • 06:21Culturing Host Cells
  • 07:30Phage Serial Dilution and Preparation of Bacteria and Phage Overlay
  • 10:37Data Analysis and Results
  • 11:35Results

Saggio delle placche: un metodo per determinare il titolo virale in unità formanti placca (UFP)

English

Share

Overview

Fonte: Tilde Andersson1, Rolf Lood1
1 Dipartimento di Scienze Cliniche Lund, Divisione di Medicina delle Infezioni, Centro Biomedico, Università di Lund, 221 00 Lund, Svezia

I virus che infettano gli organismi procariotici, chiamati batteriofagi o semplicemente fagi, sono stati identificati all’inizio del 20° secolo da Twort (1) e d’Hérelle (2) indipendentemente. Da allora i fagi sono stati ampiamente riconosciuti per il loro valore terapeutico (3) e la loro influenza sugli ecosistemi umani (4), così come globali (5). Le attuali preoccupazioni hanno alimentato un rinnovato interesse per l’uso dei fagi come alternativa ai moderni antibiotici nel trattamento delle malattie infettive (6). Essenzialmente tutta la ricerca sui fagi si basa sulla capacità di purificare e quantificare i virus, noto anche come titolo virale. Inizialmente descritto nel 1952, questo era lo scopo del test della placca (7). Decenni e molteplici progressi tecnologici dopo, il test della placca rimane uno dei metodi più affidabili per la determinazione del titolo virale (8).

I batteriofagi sopravvivono iniettando il loro materiale genetico nelle cellule ospiti, dirottando i macchinari per la produzione di nuove particelle fagiche e alla fine causando all’ospite di rilasciare numerosi virioni di progenie attraverso la lisi cellulare. A causa delle loro dimensioni ridotte, i batteriofagi non possono essere osservati usando esclusivamente la microscopia ottica; pertanto, è necessaria la microscopia elettronica a scansione (Figura 1). Inoltre, i fagi non possono essere coltivati su piastre di agar nutrizionali come i batteri, poiché hanno bisogno di cellule ospiti per predare.

Figure 1
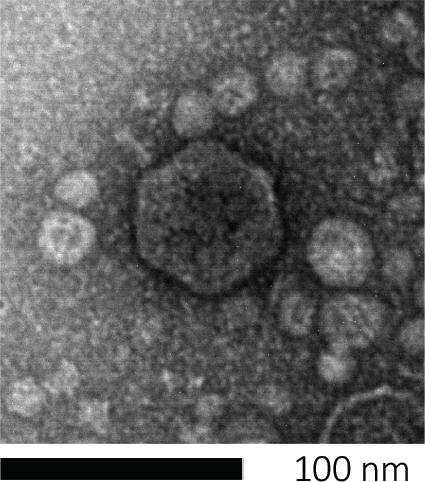
Figura 1: La morfologia di un batteriofago, qui esemplificata da un fago di E. coli, può essere studiata utilizzando la microscopia elettronica a scansione. La maggior parte dei batteriofagi appartiene a Caudovirales (batteriofagi dalla coda). Questo particolare fago ha una struttura della coda molto corta e una testa icosaedrica, collocandolo nella famiglia dei Podovirus.

Il test della placca (Figura 2) si basa sull’incorporazione di cellule ospiti, preferenzialmente in fase logaritmica, nel mezzo. Questo crea uno strato denso e torbido di batteri in grado di sostenere la crescita virale. Un fago isolato può successivamente infettare, replicarsi all’interno e lisi di una cellula. Con ogni cellula lsata, più cellule adiacenti vengono immediatamente infettate. Diversi cicli in, una zona chiara (una placca) possono essere osservati nella piastra altrimenti torbida (Figura 2B / Figura 3A), indicando la presenza di quella che inizialmente era una singola particella batteriofago. Il numero di unità formanti placche per volume(cioè PFU/mL) di un campione, può quindi essere determinato dal numero di placche generate.

Figure 2
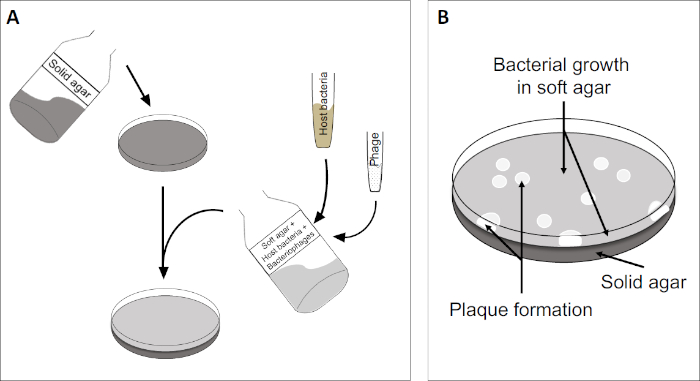
Figura 2: Il test per le unità formanti placche (PFU) è un metodo comune per determinare il numero di batteriofagi in un campione. (A) La base di una capsula di Petri sterile è coperta da un adeguato mezzo nutritivo solido, seguito da una miscela di mezzi molli, cellule ospiti sensibili e una diluizione del campione di batteriofago originale. Si noti che la sospensione dei fagi potrebbe, in alcuni casi, anche essere distribuita uniformemente sulla superficie dell’agar morbido già solidificato. (B) La crescita dei batteri ospiti forma un prato di cellule nello strato superiore di agar. La replicazione dei batteriofagi genera zone chiare, o placche, causate dalla lisi delle cellule ospiti.

Figure 3
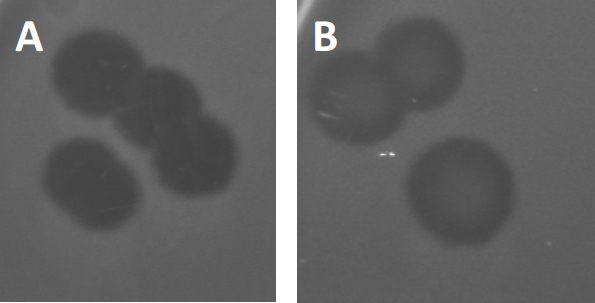
Figura 3: I risultati del test PFU mostrano placche multiple generate da batteriofagi. A causa della lisi delle cellule ospiti sensibili, le placche possono essere viste come zone di pulizia nel prato batterico, sia con (A) clearance completa, sia (B) parziale ricrescita causata dalla generazione di batteri resistenti (o possibilmente da fagi temperati nel ciclo lisogenico).

Alcuni fagi temperati possono adottare quello che viene definito un ciclo di vita litogenico, oltre alla crescita litica precedentemente descritta. Nella lisogenia, il virus assume uno stato latente attraverso l’incorporazione del suo materiale genetico nel genoma della cellula ospite (9), spesso conferendo resistenza a ulteriori infezioni fagiche. Questo a volte si rivela attraverso un leggero annebbiamento della placca (Figura 3B). Vale la pena notare, tuttavia, che le placche possono anche apparire sfocate a causa della ricrescita di batteri che hanno sviluppato resistenza al fago indipendentemente dalle precedenti infezioni dei fagi.

I virus possono attaccarsi, o adsorbire, solo a una gamma limitata di batteri ospiti (10). Gli intervalli dell’ospite sono ulteriormente limitati da strategie antivirali intracellulari come il sistema CRISPR-Cas (11). La resistenza/sensibilità verso specifici fagi mostrati da sottogruppi batterici è stata storicamente utilizzata per classificare i ceppi batterici in diversi tipi di fagi (Figura 4). Sebbene l’efficacia di questo metodo sia stata ora superata da nuove tecniche di sequenziamento, la tipizzazione dei fagi può ancora fornire preziose informazioni sulle interazioni batterio-fago, ad esempio, facilitando la progettazione di un cocktail di fagi per uso clinico.

Figure 4
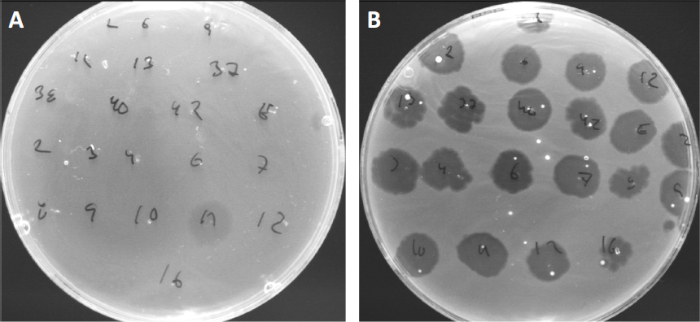
Figura 4: Sensibilità ai fagi di diversi ceppi batterici. Le piastre di agar morbido con Cutibacterium acnes ceppo (A) AD27 e (B) AD35, sono state individuate con 21 diversi batteriofagi di C. acnes. Solo il fago 11 è stato in grado di infettare e uccidere AD27 mentre il ceppo AD35 ha mostrato sensibilità verso tutti i fagi. Questa tecnica, chiamata tipizzazione dei fagi, può essere utilizzata per dividere specie e ceppi batterici in diversi sottogruppi in base alla suscettibilità dei fagi.

Procedure

1. Configurazione Prima di iniziare qualsiasi lavoro che coinvolga i microbi, assicurarsi che lo spazio di lavoro sia sterilizzato(ad esempio pulito con etanolo al 70%). Indossare sempre un cappotto da laboratorio e guanti, tenere i capelli lunghi legati all’indietro e assicurarsi che eventuali ferite siano particolarmente ben protette. Al termine, sterilizzare tutte le superfici e lavare accuratamente / sterilizzare mani e polsi. 2. Pr…

Applications and Summary

Despite multiple technological advances, plaque assays remain the gold standard for determination of viral titer (as PFU) and essential for isolation of pure bacteriophage populations. Susceptible host cells are cultivated in the top coat of a two layered agar-plate, forming a homogenous bed enabling viral replication. The initial event where an isolated bacteriophage in lytic lifecycle infects a cell, replicates within it, and eventually lyses it, is too small to observe. However, the virions released will infect adjacent cells, subsequently giving rise to a clearing zone, or plaque, denoting the presence of a single PFU.

References

  1. Twort, F. An investigation on the nature of ultra-microscopic viruses. Lancet. 186 (4814): 1241-1243. (1915)
  2. d'Hérelle, F. An invisible antagonist microbe of dysentery bacillus. Comptes Rendus Hebdomadaires Des Seances De L Academie Des Sciences. 165: 373-375. (1917)
  3. Cisek AA, Dąbrowska I, Gregorczyk KP, Wyżewski Z. Phage Therapy in Bacterial Infections Treatment: One Hundred Years After the Discovery of Bacteriophages. Current Microbiology. 74 (2):277-283. (2017)
  4. Mirzaei MK, Maurice CF. Ménage à trois in the human gut: interactions between host, bacteria and phages. Nature Reviews Microbiology. 15 (7):397. (2017)
  5. Breitbart M, Bonnain C, Malki K, Sawaya NA. Phage puppet masters of the marine microbial realm. Nature Microbiology. 3 (7):754-766. (2018)
  6. Leung CY, Weitz JS. Modeling the synergistic elimination of bacteria by phage and the innate immune system. Journal of Theoretical Biology. 429:241-252. (2017)
  7. Dulbecco R. Production of Plaques in Monolayer Tissue Cultures by Single Particles of an Animal Virus. Proceedings of the National Academy of Sciences of the United States of America. 38 (8):747-752. (1952)
  8. Juarez D, Long KC, Aguilar P, Kochel TJ, Halsey ES. Assessment of plaque assay methods for alphaviruses. J Virol Methods. 187 (1):185-9. (2013)
  9. Clokie MRJ, Millard AD, Letarov AV, Heaphy S. 2011. Phages in nature. Bacteriophage. 1 (1):31-45. (2011)
  10. Moldovan R, Chapman-McQuiston E, Wu XL. On kinetics of phage adsorption. Biophys J. 93 (1):303-15. (2007)
  11. Garneau JE, Dupuis M-È, Villion M, Romero DA, Barrangou R, Boyaval P, Fremaux C, Horvath P, Magadán AH, Moineau S.. The CRISPR/Cas bacterial immune system cleaves bacteriophage and plasmid DNA. Nature. 468 (7320):67. (2010)

Transcript

Bacteriophages, also called phages, are viruses that specifically infect bacteria and we can confirm their presence and quantify them using a tool called the plaque assay. Bacteriophages infect their susceptible hosts by first attaching to the bacterial cell wall and injecting their genetic material. Then, they hijack the cell’s biosynthetic machinery to replicate their DNA and produce numerous progeny phage particles, which they then release by lysing and killing the host cell.

This lytic activity is the basis of a widely used phage enumerating technique known as the plaque assay or double agar layer assay. Here, a bacteriophage mix is first prepared in a molten nutrient broth containing low concentration agar. All bacteria used in the mix should be alive and actively dividing in the log phase of their growth, which will ensure that a large percentage of the bacteria are viable and able to form a dense lawn around the plaques. Next, this molten bacterial-phage agar mix is spread over a more solid, concentrated agar nutrient medium which is already solidified on a Petri dish. On incubation at room temperature, the low concentration agar-phage-bacteria broth also solidifies to form a soft agar overlay.

Here, the bacterial cells can derive additional nutrients from the bottom layer and should rapidly multiply to produce a confluent lawn of bacteria. However, as phage particles are also present in the soft layer, these will infect and replicate their genetic material within the bacteria, culminating in cell lysis, which releases multiple progeny. These phage progeny then infect the neighboring cells, as the semi-solid state of the bacteria-phage layer restricts their movement to more distantly located host cells. This cycle of infection and lysis continues over multiple rounds, killing a large number of bacteria in a localized area. The effect of the neighboring cells being destroyed, is to produce a single circular clear zone, called a plaque, which can be seen by the naked eye, effectively amplifying the bacteria lytic activity of the phage and enabling their enumeration.

The number of plaques on a Petri dish are referred to as Plaque-Forming Units, or PFUs, and, providing the initial bacteriophage concentration was sufficiently dilute, should directly correspond to the number of infective phage particles in the original sample. This technique can also be used for characterization of plaque morphology, to aid in identification of phage types, or to isolate phage mutants. In this lab, you will learn how to perform the plaque assay for enumerating phages, using the T7 phage of E. coli as an example.

First, identify a suitable medium for the culturing of the host bacterial cells and the bacteriophage. Here lysogeny broth, or LB medium, was used to culture E. coli and the T7 phage. Next, take three clean glass bottles and label them with media, name, and then the first as LB-Broth, the second as LB-Bottom Agar, and the third as LB-Top Agar. Now, weigh out four grams of pre-formulated LB powder in three sets and then transfer one set of weighed dried media into each bottle. Add 200 milliliters of water to the first bottle. Mix the contents using a magnetic stir bar.

Then, using a pH meter and constant stirring, bring the final pH to 7.4 through the addition of sodium hydroxide or hydrochloric acid. Repeat the water addition and pH adjustment for the other two remaining bottles, as well. Now, weigh out three grams of agar powder and add it to the second bottle to make a 1.5 % bottom agar. Finally, weigh 1. 2 grams of agar and add it to the third bottle to make the .6 % LB top agar. The broth condition in bottle one does not need an agar addition. Cap the bottle semi-tightly and then, sterilize the media by autoclaving at 121 degrees Celsius for 20 minutes. Once complete, remove the media bottles from the autoclave and immediately twist the bottle caps to close them fully to prevent contamination. Keep the LB-Broth and LB-Top Agar media on the bench for later use. Place the LB-Bottom Agar to cool in a water bath that is preset to approximately 45 degrees Celsius.

When the LB-Bottom agar reaches approximately 45 degrees Celsius, transfer it to the work bench. Next, sterilize the workspace using 70 % ethenol. Next, add 450 microliters of sterile one molar calcium chloride to the molten bottom agar to make a final concentration of 2.25 millimolar. Gently swirl the bottle to mix. Then, set out seven clean Petri dishes. Label each dish on the bottom with the media name and preparation date. Then, pour 15 milliliters of the bottom agar into each of the seven Petri dishes. Allow the plates to set for a few hours or overnight at room temperature. Once set, the culture plates can be stored at four degrees Celsius for several days if needed, upside down to minimize condensation. Transfer the Petri dishes from the four degrees Celsius refrigerator to a 37 degrees Celsius incubator one hour before the assay.

The day before the assay is to be preformed, the E. coli should be cultured. Here, 10 microliters of E. coli culture was inoculated into 10 milliliters of LB-Broth. Place the bacteria to grow overnight in a shaking incubator set to 37 degrees Celsius at 160 RPM. Then, on the day of the assay, remove the bacterial culture from the incubator. Seed a fresh 10 milliliters of fresh LB broth with 0.5 milliliters of the overnight culture. Place these cells to grow into a shaking incubator set to 37 degrees Celsius at 160 RPM. Next, use a spectrophotometer to check when this culture reaches log phase growth, indicated by an optical density of 0.5 to 0.7. Once the OD reaches this level, stop the incubation by transferring the cell culture to the bench. They are now ready to be used for phage overlay assay.

Phage titers can vary exponentially across different phage types and samples. So in order to count them effectively, they should be diluted to generate a wide range of phage concentrations. On the day of the assay, generate a series of phage dilutions ranging from one tenth to one millionth concentrations, following a 10-fold dilution technique. To obtain statistically significant and accurate data, perform the serial dilution in triplicate.

Next, melt the solidified LB-top agar using a microwave. Then, place it in a water bath that is preset at 45 degrees Celsius for one hour. After one hour, collect the Petri dishes containing the bottom agar layer from the incubator. Label the plates with phage concentration and assay date. Then, set out seven clean test tubes. Label each test tube with the serial phage dilution number and designate one as control.

When the LB-top agar reaches 45 degrees Celsius, transfer it to the working bench. Now, add 450 microliters of one molar calcium chloride to the 200 milliliter agar to make a final concentration of 2.25 millimolar. Gently swirl the bottle to mix. Next, add 35 milliliters of LB-top agar and four milliliters of bacterial suspension to a sterile conical tube. Gently swirl to evenly distribute the cells but avoid shaking to prevent foaming.

Now, aliquot five milliliters of this bacteria- top agar mix to each of the seven test tubes. Then, transfer 100 microliters of the serially diluted bacteriophage samples and control media, which should be simply media with no bacteriophage, to the respectfully labeled test tubes. Swirl the mixture gently to ensure proper mixing. Gently transfer five milliliters of bacteriophage mix onto the respective Petri plate. Evenly spread the mix throughout the whole surface by gently swirling the Petri plate.

Once all of the Petri plates are layered with the mix, allow solidification of the top layer by incubating at room temperature for 15 minutes. After completion of these steps, repeat the process for the second and then the third sets of the Petri dishes using the remaining two sets of phage dilutions. Seal each dish with parafilm and incubate at room temperature for 15 minutes. Place the culture plate upside down at a suitable temperature for 24 hours or until plaques develop. Here, plates were placed in a 37 degrees Celsius incubator for one day, a stimulating growth condition for E. coli and the T7 phage.

Plaques will appear after one to five days of incubation, depending on the bacterial species, incubation conditions, and the choice of medium. Here, plaques were visible after one day of incubation at 37 degrees Celsius. Begin by checking the plates marked control and ensure that no plaques were formed in these plates, as this would indicate viral contamination. To determine the phage titer in the original sample, start with the plates containing the most diluted phage sample first and count the plaques without removing the lids, marking them to indicate which ones have already been counted. Repeat the counting for each plate in every set. Some plates might have too many or too few plaques to be counted. Consider 10 to 150 as an ideal plaque count.

Next, generate a table listing the plaque number values for the different dilutions and replicates. Then, calculate the mean plaque number values for the dilution plates that contained the ideal number of plaque counts. In this example, these were the average number of plaques formed in the 10 to the minus three and 10 to the minus four dilution plates. Now, adjust for phage dilution factor by dividing the obtained mean plaque values by the respective phage dilution factors. Here, the average number of plaques formed to the 10 to the minus three and 10 to the minus four dilution plates, were divided by their respective dilution factors to obtain the number of plaque forming units, or PFUs, in 100 microliters of phage mixture. To convert the value to PFU per milliliter, multiply the generated values by 10, as only 100 microliters of phage dilution mix was used during the bacteriophage overlay preparation step, producing an additional dilution factor of 10. Finally, calculate the average of the values obtained from the different dilution plates. This will give the average number of PFUs per milliliter. The number of PFUs corresponds to the number of infective phage particles in the original sample.

Tags

Cite This
JoVE Science Education Database. JoVE Science Education. Plaque Assay: A Method to Determine Viral Titer as Plaque Forming Units (PFU). JoVE, Cambridge, MA, (2023).