We describe a high-throughput drug sensitivity assay for primary multiple myeloma cells. It consists of a reconstruction of the bone marrow microenvironment (including extracellular matrix and stroma) in multi-well plates, and a non-invasive method for longitudinal quantification of cell viability.
In this work we describe a novel approach that combines ex vivo drug sensitivity assays and digital image analysis to estimate chemosensitivity and heterogeneity of patient-derived multiple myeloma (MM) cells. This approach consists in seeding primary MM cells freshly extracted from bone marrow aspirates into microfluidic chambers implemented in multi-well plates, each consisting of a reconstruction of the bone marrow microenvironment, including extracellular matrix (collagen or basement membrane matrix) and stroma (patient-derived mesenchymal stem cells) or human-derived endothelial cells (HUVECs). The chambers are drugged with different agents and concentrations, and are imaged sequentially for 96 hr through bright field microscopy, in a motorized microscope equipped with a digital camera. Digital image analysis software detects live and dead cells from presence or absence of membrane motion, and generates curves of change in viability as a function of drug concentration and exposure time. We use a computational model to determine the parameters of chemosensitivity of the tumor population to each drug, as well as the number of sub-populations present as a measure of tumor heterogeneity. These patient-tailored models can then be used to simulate therapeutic regimens and estimate clinical response.
The goal of this method is to characterize the drug sensitivity of multiple myeloma (MM) primary cells to a panel of agents ex vivo, as close as possible to physiological conditions, and with sufficient precision that these results can be used to identify chemoresistant sub-populations within the tumor burden and, ultimately, to parameterize computational models designed to estimate clinical response.
Computational models are powerful tools to analyze complex systems, such as cancer-host-therapy interactions. However, models are only as good as the data used to parameterize them. Unfortunately, most data available in literature cannot be used in its current form to parameterize such models, as they often are obtained in mutually exclusive experimental conditions. Thus, new experiments are often required with the goal of obtaining the set of experimental parameters needed. Most viability assays, however, are destructive and thus limited to a small number of time points, often only one. This greatly handicaps the usage of chemosensitivity assays to parameterize computational models, since such experiments fail to provide information on the temporal dynamics of the system. This is especially true with primary cancer cells, which are often limited to a few millions per sample, and have a short lifespan after biopsy, thus limiting the number of experimental conditions available. In addition, most viability assays require the separation of the cancer from the non-cancer (stroma) cells at the time of quantification, which adds extra work to the protocol, further perturbs the cells, and limits the number of experiments that can be performed.
40 years ago, Salmon and collaborators1 proposed their famous in vitro colony formation assay for assessment of chemosensitivity of tumor cells. Unfortunately this assay found mixed success due to the small number of multiple myeloma (MM) patient samples that were capable of forming colonies under control conditions: It was estimated that only a small subgroup of 0.001% to 0.1% of MM cells were capable of replication, being termed as multiple myeloma stem cells2. This significantly limited the success rate of the assay and the number of drugs that could be tested at one time, even in more recent models3. This issue is much more important now when MM agents (standard or experimental) are more numerous than four decades ago.
A major limitation of these early assays is their dichotomized output: either a patient is “sensitive” or “resistant” to a particular drug. No information is provided regarding the degree of sensitivity and heterogeneity of the tumor population. Thus, patients with small sub-populations of fast-growing resistant cells would be classified as “sensitive” to therapy, but would relapse shortly, and thus not benefit from treatment. Given the importance of duration of response in overall survival (OS) of cancer patients4,5, it is clear how these assays were not able to properly estimate OS consistently.
In order to circumvent these limitations, and to be able to generate patient-specific computational models that would estimate personalized clinical response to a panel of drugs, we have developed a method for non-destructively testing drug sensitivity of multiple myeloma (MM) cell lines and primary MM cells in an ex vivo reconstruction of the bone marrow microenvironment, including extracellular matrix and stroma6. This assay, however, had the limitation of relying on a particular commercial microfluidic slide, whose dimensions and cost restricted the number of experiments or drugs that could be performed at once in a given piece of equipment.
The here described system extends this original assay into a high-throughput organotypic dose-response platform, for in vitro screening of drugs, based on a digital image analysis algorithm to non-destructively quantify cell viability. Each well in 384 or 1,536-well plates is a 3D reconstruction of the bone marrow microenvironment, including primary MM cells, extracellular matrix, and patient-derived stroma and growth factors. Live microscopy and digital image analysis are used to detect cell death events in different drug concentrations, which are used to generate dose-response surfaces. From the in vitro data, a mathematical model identifies the size and chemosensitivity of sub-populations within the patient’s tumor burden, and can be used to simulate how the tumor would respond to the drug(s) in physiological conditions in a clinical regimen6 (Figure 1).
The main innovations of this platform are: (a) small number of cancer cells required (1,000-10,000 per drug concentration); (b) assessment of drug efficacy in physiological conditions (extracellular matrix, stroma, patient-derived growth factors); (c) No toxicity from viability markers7 since only bright field imaging is used, thus no need to transfect cells with fluorescence8 or bioluminescence9; (d) continuous imaging provides drug effect as a function of concentration and exposure time (pharmacodynamics); and (e) the integration between in vitro and computational evolutionary models, to estimate clinical outcome6 (Silva et al., in preparation).
The key factor that allows the digital image analysis algorithm to discern cancer from stromal cells is their different affinity to the bottom of the well: MM cells do not adhere, and remain in suspension in the matrix, while stromal cells adhere to the bottom of the well and then stretch.
This separation occurs even though MM and stroma are seeded at the same time, and occurs during the O/N process of incubation. The spinning down in the centrifuge following seeding of the plate further accelerates this process. As a consequence, MM cells appear in the image as round bright disks surrounded by a dark ring, while the stroma maintains a low profile and a darker shade (Figure 2). Thus, the assay in its current form is best suited for non-adherent cancer cells, although adjustments in the algorithm could be done to separate cancer and stroma based on other morphologic features, such as size and shape. In this protocol we describe two types of extracellular matrix (collagen and basement membrane matrix) as well as two types of co-cultures, with (bone marrow derived mesenchymal stem cells) BMSC and HUVECS, representing the interstitial and perivascular niches of the bone marrow, respectively.
Using a 384-well plate, 5 concentrations per drug and two replicates, we were able to test up to 31 different drugs with the sample of a single patient. In 1,536-well plates this number is 127. Figure 3 depicts the layout currently used for manual cell seeding, while Supplemental Figure 1 represents the optimum distribution using a robotic pipettor. In the design from Figure 3, each 384-well plate can carry 3 patient samples with 7 different drugs, or one patient sample tested with 21 drugs. Each drug is represented by 5 concentrations, and each condition is seeded in duplicates. 4 control wells (no drug added) are seeded for each set of 7 drugs (e.g., wells 36-39, 126-129 and 200-203). To ensure the potency of the drugs used, a human myeloma cell line (e.g., H929 or MM1.S) is also seeded, and drugged in duplicates at the highest concentration of each of the drugs used (wells 76-89). The positive cell line control ensures that the drugs used have adequate potency, since their dose response curves are comparable across experiments. Two wells are seeded with a myeloma cell line as control for the environmental conditions, in other words, to detect possible problems in the bench top incubator during imaging (wells 75 and 90). The enumeration of the wells follows a zigzag pattern in order to reduce the distance covered by the motorized stage of the microscope, which reduces acquisition time and reduces wear of the equipment.
The use of human cells derived from biopsies as described below was approved by Moffitt’s Institutional Review Board and conducted under the clinical trial MCC# 14745 conducted at the H. Lee Moffitt Cancer Center and Research Institute.
1. Sorting of MM Cells from Bone Marrow Aspirates
2. Seeding Cells in Plates (Using a Manual Multi-channel Pipettor)
3. Seeding Cells in Plates (Using a Robotic Pipettor)
Note: This series of steps seeds a 384-well plate using a robotic pipettor. The design of the plate is depicted in Supplemental Figure 1, where primary MM cells are tested against a panel of 31 different drugs at five different concentrations in two replicates, plus negative control. A cell line is also seeded as positive control for assessment of drug efficacy and tested against all 31 drugs at the highest concentration, in two replicates. The files provided are for a particular brand and model (see Materials table) but the algorithm can be adapted to any robotic pipettors.
4. Drug Preparation and Drugging of Plates (Using a Manual Multi-channel Pipettor)
5. Drug Preparation and Drugging of Plates (Using a Robotic Pipettor)
6. Imaging of Cells in Plate
Note: The procedure below applies to the Evos Auto FL microscope, but can be readily adapted to other motorized stage microscopes with bench top incubation or incubator-embedded microscopes.
7. Quantification of Drug Sensitivity
Note: The following instructions guide the use of the image analysis using a computer cluster, since the analysis of a multi-well plate in a personal computer is extremely time consuming.
The flow of the experiment is briefly described in Figure 1. If all steps are completed successfully, the images obtained by the microscope should be equivalent to Figure 2: live MM cells should be clearly seen as bright disks and BMSCs or HUVECs should be barely visible and well distributed in the background. As seen in Figure 2A, MM cells range in size from one patient to the other, but in general they are smaller than cell lines. Since they practically do not replicate ex vivo during the interval of the experiment (96 hr) they can be seeded at higher concentrations (1-3 million cells/ml). Stroma should be barely detectable, as BMSC adhere to the bottom of the well and stretch, presenting a low profile. The human myeloma cell line H929 is significantly larger than patient-derived MM cells (Figure 2B), and replicates within 24 hr. To prevent crowding of the image, MM cell lines are seeded a lower densities, 0.3 million/ml. Figures 2C and 2D represent patient-derived MM cells and human myeloma cell lines H929, respectively, co-cultured with HUVECS. HUVECS first adhere to the bottom of the well and then begin to contact each other and form networks, which later become thicker and with lumens.
Figure 4 exemplifies what is to be expected from the processed videos generated by the image analysis algorithm, showing detected live MM cells pseudo-colored in green (Figure 4A) with no or very little green signal in BMSCs and HUVECs at the end of the experiment in the highest drug concentration, when all MM cells are dead (Figure 4B). The software should aggregate the results from different wells and build a chart depicting gradual loss of viability with time of exposure at different drug concentrations (Figure 4C). The curve of dose response of the control cell line (e.g., H929 or MM1.S) should be the same as for previous experiments; significant deviations might indicate problems with the stock solution of drug used in the experiment.
It is important to carefully observe all the wells seeded before starting the imaging process, as artifacts may mislead the image analysis software and lead to false results. For instance, Figure 5A shows the result of an excessive density of BMSCs in the well or too much time elapsed between trypsinization and seeding, leading to these cells forming clumps. Figure 5B shows “colonies” of MM cells. If cell lines are seeded at high densities, they will form colonies as they replicate and this reduces the accuracy of the digital image analysis algorithm as it becomes increasingly difficult to discern one cell from the other. Figure 5C is an example of the opposite, where too few MM cells were seeded. This often occurs when the number of MM cells obtained from the bone marrow aspirate is below 500,000, and the “dead volume” left in the tube before re-suspension becomes comparable to the volume of media required to re-suspend MM cells in high densities. To solve this problem, determine the dead volume for the tube being used and include it in the dilution calculations. Figure 5D is an example of skewed focal plane. Note how MM cells on top left are bright and the ones in the bottom right are dark. This is caused by am unevenly placed plate or incorrectly placed objective. This will cause MM cells in different sections of the image to be counted differently. Scale bars (bottom right of each image) represent 500 µm.
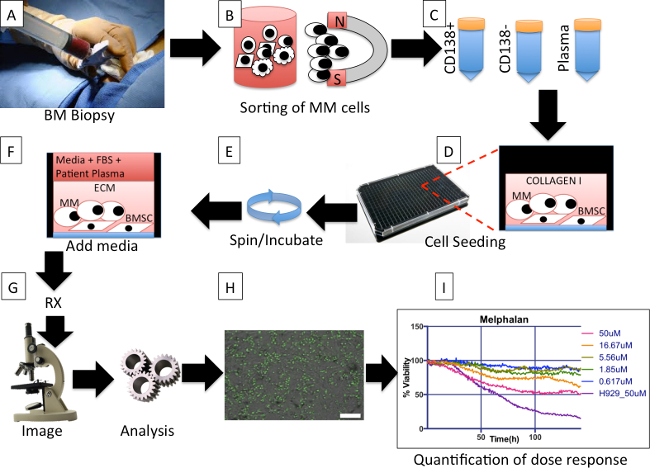
Figure 1. Protocol overall description. (A) During a bone marrow biopsy one extra tube of aspirate is obtained for the protocol. (B) Multiple myeloma (MM) cells are magnetically separated from other cells in the aspirate. (C) Three tubes, containing MM cells (MM), non-MM cells, and plasma, respectively, are obtained from the separation process. (D) Bone marrow derived mesenchymal stem cells (BMSCs) from previous aspirates are co-cultured with freshly obtained MM cells, and re-suspended in extracellular matrix (collagen or basement membrane matrix). (E) The plate is spun down to ensure that as many MM as possible are in the same focal plane and the BMSC are ready to adhere to the bottom of the well. The plate is placed in incubator until matrix polymerizes. (F) Each well is filled with a mix of culture media and patient-derived plasma. The plate is placed in an incubator O/N. (G) Drugs are added to each well and the plate is placed in a microscope equipped with a digital camera, motorized stage and bench top incubator, and imaged at regular intervals for a period of 96 hr. (H) The image files for each well are analyzed using an algorithm that segments live MM cells based on membrane motion (live cells are pseudo colored in green) and creates a spreadsheet with changes in cellularity for each well for each time point. Scale bar (bottom right) represents 500 µm. (I) A software program groups the wells by drugs and concentrations and creates a spreadsheet with curves of dose response normalized so that initial measures are 100%. Please click here to view a larger version of this figure.
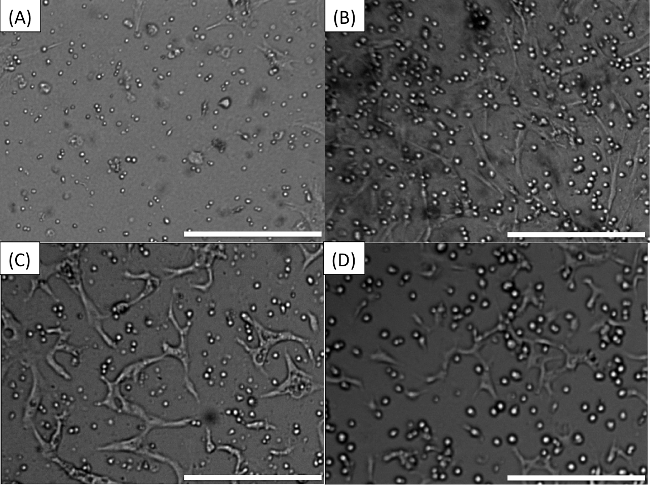
Figure 2. Pre-drug expected appearance of wells. (A) MM cells co-cultured with stroma. (B) The human myeloma cell line H929 co-cultured with stroma. (C) Patient-derived MM cells in co-culture with HUVECS. (D) Human myeloma cell line H929 in co-culture with HUVECS. Scale bars (bottom right of each Figure) represent 500 µm. Please click here to view a larger version of this figure.
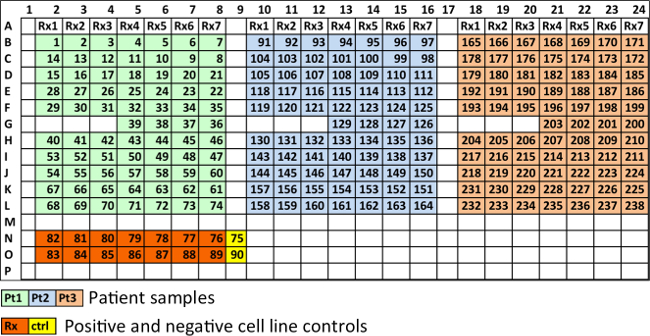
Figure 3. Recommended spatial distribution of wells in a 384-well plate. Each 384-well plate can carry 3 patient samples with 7 different drugs, or one patient sample tested with 21 drugs. Wells in light green, light blue and tan, contain MM cells from three different patients. Rx1, Rx2, etc., represent different drugs, each at five different concentrations and in duplicate. Four wells are used as controls for each patient (36-39 for patient 1, 126-129 for patient 2 and 200-203 for patient 3). Wells in orange contain cell lines at highest drug concentration of each drug, in duplicate. Wells in yellow are cell line controls (no drug). Please click here to view a larger version of this figure.
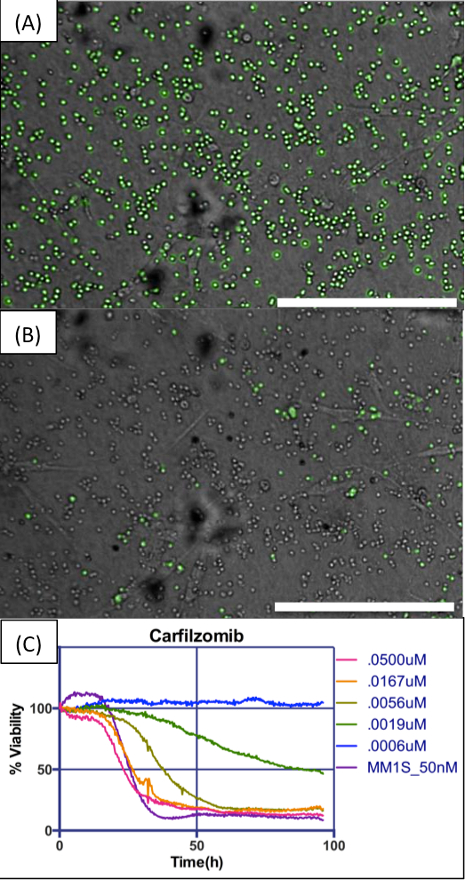
Figure 4. Example of digital image analysis and dose response charts. (A) MM cells in co-culture with BMSCs, embedded in collagen I, exposed to a concentration of 50 nM carfilzomib. Image analysis algorithm detects live cells and pseudo-colors them in green. (B) Images are acquired at regular intervals for the duration of the experiment. In this concentration of drug, almost all cells are dead at the end of 96 hr. (C) The chart shows changes in number of viable cells for five different concentrations of carfilzomib along an interval of 96 hr, normalized for time = 0 hr as 100%. The human myeloma cell line MM1.S was used as control for drug efficacy. Scale bars (bottom right of A and B) represent 500 µm. Please click here to view a larger version of this figure.
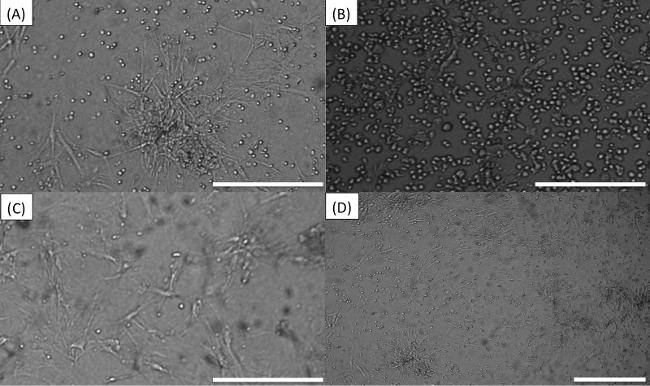
Figure 5. Common errors while seeding or imaging plate. (A) Stroma cells “tangled”. (B) “Colonies” of MM cells. (C) Too few MM cells. (D) Skewed focal plane. Scale bars (bottom right of each image) represent 500 µm. Please click here to view a larger version of this figure.
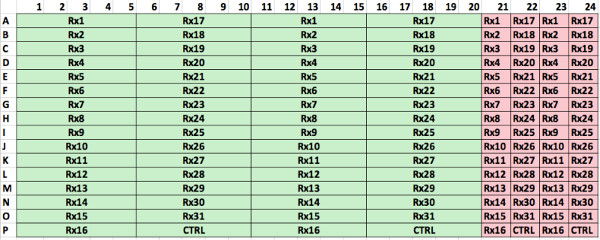
Supplemental Figure 1. Optimum spatial distribution of wells in 384-well plate using a robotic pipettor. In this configuration 31 different drugs can be tested at 5 different concentrations and 2 replicates (green). In addition, positive controls with a cell line can be used to ensure drug potency (pink). Please click here to view a larger version of this figure.
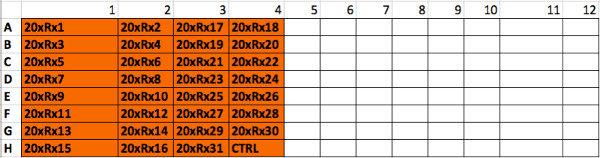
Supplemental Figure 2. Spatial distribution of drug “master plate”. The robotic pipettor will use this plate where each well contains one of the 31 drugs at 20x concentration, to create the drug dilution plate. Please click here to view a larger version of this figure.
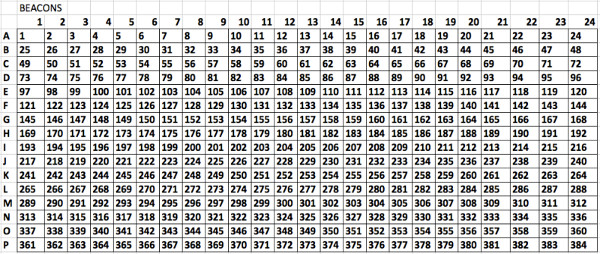
Supplemental Figure 3. Numbering of wells to be used when preparing a plate with a robotic pipettor. The software described in the protocol requires this numbering of the wells in order to adequately map the wells to the drugs and concentrations. Please click here to view a larger version of this figure.
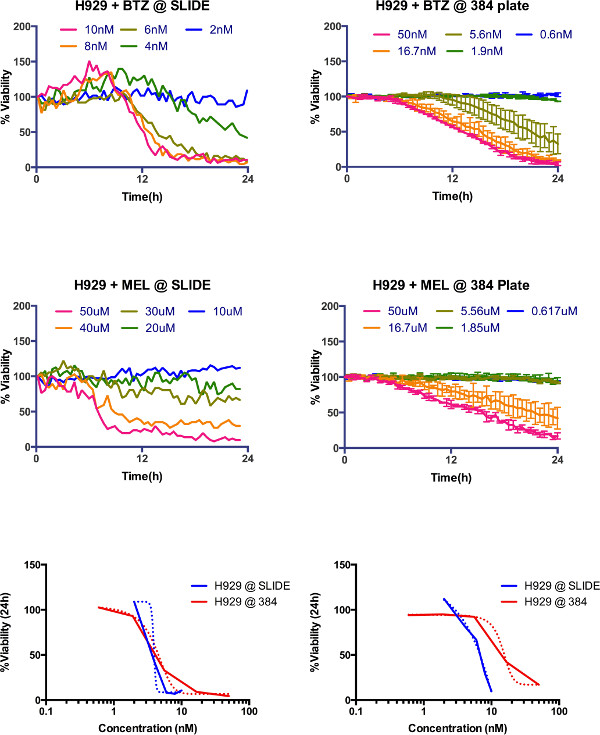
Supplemental Figure 4. Comparison between microfluidic slide (Khin et al., 2014) and current protocol. Dose response of H929 multiple myeloma cell line measured for 24 hr in the previous system (top left bortezomib, middle left melphalan) and in current system (top right bortezomib and middle right melphalan). For comparison purposes, LD50 at 24 hr for both platforms was 3.9 nM and 4.1 nM for bortezomib, and 6.4 µM and 14.65 µM for melphalan. Please click here to view a larger version of this figure.
In summary, this is a powerful and high throughput method to quantify chemosensitivity of primary MM cells and ex vivo pharmacodynamics of drugs in a reconstruction of the bone marrow. The critical steps within this protocol are the proper seeding of the wells and adequate focusing (see Figure 2 for expected results): ensure that MM and stromal cells are uniformly distributed, that stromal cells are adherent to the bottom of the well, that all MM cells are in the same focal plane, and that MM cells have the aspect of a bright disc surrounded by a dark ring.
In case of improper seeding (see Figure 5), do not continue with the experiment, but rather seed a second plate. If the problem detected was low or high MM or stroma cell density, check the cell concentration in the tube before seeding and resuspend at regular intervals during the seeding process to ensure homogeneous distribution of cells in media. The use of a multi-channel pipette with repeater function or robotic dispenser can significantly reduce this problem. The proportion of cell/matrix to media (1:10) used in this assay sought to maximize the number of wells that could be seeded and thus conditions studied. However, to study soluble factors produced or consumed by cancer cells or stroma, it is recommended that a proportion of cell/matrix to media be 1:1.
As currently implemented, this system quantifies only the non-adherent cells. In order to quantify changes in cellularity of stroma the software would need to be modified and adjusted to the morphological characteristics of the stroma. This would be a useful feature to study the effect of cancer cells or drugs in the stroma compartment. The here-described system is also unable to quantify cellularity of adherent cancer cells, especially if they are combined with adherent stroma. The solution would be modifications in the digital image analysis algorithm to separate the cancer from stroma based on morphological features, or to pre-incubate either population with a fluorescent dye that could be used to identify cells from either population.
The significance of this protocol compared to previous approaches is the ability of assess drug response of primary cancer cells in an ex vivo reconstruction of the bone marrow microenvironment in a non-destructive manner, so that sequential measurements can be made, thus providing much more detailed information of the pharmacodynamics, rather than at fixed time points. One of the limitations of our prior assay6 was the linear gradient generated by drug diffusion, which only allowed assessment of drug sensitivity within a linear window of concentrations. The current assay allows assessment of viability across any range of drug concentrations, since each well is a separate entity. Both assays, however, generate equivalent results (Supplemental Figure 4).
Among the multiple future applications of this approach, our group is focused in using mathematical models to extrapolate the pharmacodynamics information provided by these assays into clinical response. To achieve this goal we propose to fit the data points obtained (Figure 4C) for each drug to a system of differential equations, describing the dynamics of drug-induced cell death. Then, by applying to these mathematical models the known pharmacokinetic properties of each drug in a clinical regimen, it would be possible to estimate the actual response of the patient6. By automating seeding and drugging using a robotic system, it would be possible to test not only standard of care drugs, but also over one hundred experimental drugs per sample (in a 1,536 well plate). This would open the possibility for in silico clinical trials, where hundreds of experimental drugs could be tested in cohorts of patients samples, thus creating survival curves for virtual clinical trials13.
The authors have nothing to disclose.
This research was funded by the State of Florida's Bankhead-Coley Team Science Grant (2BT03), the National Institutes of Health/National Cancer Institute (1R21CA164322-01) and Moffitt Cancer Center’s Team Science Grant. This work has been supported in part by the Translational Research Core Facility at the H. Lee Moffitt Cancer Center & Research Institute, an NCI designated Comprehensive Cancer Center (P30-CA076292). Access to primary cells was made possible through the Total Cancer Care Protocol at the Moffitt Cancer Center.
EVOS FL AUTO | AMG | AMAFD1000 + AMC1000 | Digital microscope equipped with motorized stage and bench top incubator. |
384-well plate CellBind | CORNING | CLS3683 SIGMA | Corning CellBIND 384 well plates 384 well plate, polystyrene, CellBIND surface, sterile, clear flat bottom, black, w/lid |
1,536-well plate CellBind | CORNING | CLS3832 ALDRICH | Corning 1536 well plates, low base, surface treatment CellBIND, sterile |
Ficoll-Paque Plus | GE Healthcare | GE17-1440-02 SIGMA | For in vitro isolation of lymphocytes from human peripheral blood. |
CD138 magnetic beads | Miltenyi | 130-051-301 | Antibody conjugated magnetic beads for selection of CD138+ cells. |
LS columns | Miltenyi | 130-042-401 | Column for separation of cells. |
MidiMACS Separator | Miltenyi | 130-042-302 | Magnet for separation column. |
Matrigel | Sigma-Aldrich | E6909 SIGMA | ECM Gel from Engelbreth-Holm-Swarm murine sarcoma |
Getrex | Life Technologies | A1413201 | LDEV-Free Reduced Growth Factor Basement Membrane Matrix |
HUVEC | Life Technologies | C-003-25P-B | Human Umbilical Vein Endothelial Cells (HUVEC ) |
RPMI-1640 media | GIBCO | 11875-093 | RPMI 1640 Medium + L-Glutamine + Phenol Red |
FBS Heat inactivated | GIBCO | 10082-147 | Fetal Bovine Serum, certified, heat inactivated, US origin |
3.1mg/mL Bovine collagen type I | Advanced Biomatrix | 5005-B | Bovine Collagen Solution, Type I, 3 mg/ml, 100 ml |
Precision XS | BIOTEK | PRC3841 | Robotic pipettor system |