Summary

멀티 모달 이미징 및 비 침습적에 대한 분광학 섬유 다발 Microendoscopy 플랫폼,<em> 생체</em> 조직 분석

Published: October 17, 2016
doi:

Summary

The assembly and use of a multimodal microendoscope is described which can co-register superficial tissue image data with tissue physiological parameters including hemoglobin concentration, melanin concentration, and oxygen saturation. This technique can be useful for evaluating tissue structure and perfusion, and can be optimized for individual needs of the investigator.

Abstract

최근 섬유 다발 microendoscopy 기술 이미징 기술 또는 분광 기술들의 조합을 사용하여 생체 내 조직의 비파괴 분석을 가능하게한다. 하나의 광학 탐침으로 이미징 분광기 기술을 결합하여 조직 상태의보다 완전한 분석을 제공 할 수있다. 이 기사에서는 두 개의 서로 다른 양식은 하나의 광학 프로브로, 고해상도 형광 microendoscopy 이미징 및 확산 반사율 분광학을 결합됩니다. 고해상도 형광 microendoscopy 촬상 주로 질적 기술되지만, 종양 및 비 종양 조직 간의 효율적인 실시간 분화를 보여 주었다, 정점 조직 미세 구조를 시각화하기 위해 사용되는 기술이며. 확산 반사율 스펙트럼은 로컬 헤모글로빈 농도 멜라닌 농도, 산소 포화도를 포함한 조직 생리 학적 파라미터를 추출 할 수있는 기술이다. 이 글은 사양 r에 대해 설명계측을 구축하고 생체 인간의 피부에 기술을 보여줍니다하는 방법, 광섬유 프로브를 구성하는 equired. 이 작품은 조직 마이크로 아키텍처, 특히 혀끝의 피부 각질 세포가, 그와 관련된 생리 학적 매개 변수와 함께 공동 등록 할 수 있습니다 것으로 나타났습니다. 여기에 제시된 수단 및 섬유 다발 프로브 장기 다양한 시스템에서 사용하기위한 핸드 헬드 또는 내시경 호환 장치 중 하나로 최적화 될 수있다. 추가의 임상 연구는 상이한 상피 질환 상태에 대한 이러한 기술의 가능성을 테스트하기 위해 필요하다.

Introduction

섬유 다발 microendoscopy 기술은 일반적으로 영상 기술 또는 분광 기술들의 조합을 사용하여 생체 조직에서 분석한다. 1-3 그러한 영상 법 고해상도 형광 microendoscopy 서브 셀룰러 해상도 이미지 수 혀끝 조직 미세 구조를 소형으로 , 마이크로 시야, 같은 proflavine, 형광, 또는 pyranine 잉크 등의 국소 조영제를 사용. 1,3-11이 영상 양상이 질적으로 저와 함께 실시간으로 질병과 건강 상피 조직을 차별화 임상 성능을 약속 보여 주었다 간 관찰자 변화. 8 때때로, 연구자는 세포 핵 크기 또는 선 곳은 양적 특징을 추출하는 고해상도 형광 현미경 데이터를 사용하지만이 조직 형태를 시각화 대상으로 주로 질적 기술 남아있다. -1,3,8- 트라이 한편 10 분광 기술, 예컨대확산 반사율 분광학으로, 기능 조직의 정보를 제공하고 정량적으로 여러 장기에 암 병변을 확인하는 임상 성능을 약속 보여 주었다 대상으로한다. 2,12-15

따라서, 잠재적으로, 또한 관찰자 간 변이성을 감소 조직 마이크로 아키텍처의 실시간 시각화를 유지하고, 조직 상태의보다 완전한 분석을 제공하는 양식의 두 가지 유형을 포함하는 장치에 대한 필요성이 존재한다. 이 목표를 달성하기 위해, 복합 프로브 기반 장비가 단일 광섬유 프로브 두 가지 양상 결합한 구성 하였다. 고해상도 형광 microendoscopy 및 서브 확산 반사율 스펙트럼을 정점 정성 고해상도의 화상 (11)이 방법의 공동 레지스터 지역 헤모글로빈 농도를 포함하는 두 개의 별개의 조직 깊이에서 양적 스펙트럼 정보 (기능성)와 조직 형태 (구조적 특성) ([HB는), 멜라닌 농도 ([멜), 및 산소 포화도 (SAO 2). 11,12,16이 특정 하위 확산 반사율 스펙트럼 양상이 제공하는 두 개의 고유 한 조직의 깊이를 샘플링하기 위해 두 개의 소스 검출기 분리 (SDS에)를 사용 기저막 및 기본 조직 기질 아래로 샘플링하여 조직의 건강에 대한 포괄적 인 그림. (11)

파이버 프로브는 약 50,000 4.5 ㎛의 직경의 광섬유 요소, 1.1 mm의 클래드 직경 1.2 mm의 전체 코팅 직경 중앙 1mm 직경 화상 섬유로 구성된다. 이미지 섬유는 220 ㎛, 클래딩 직경이 오 200 μm의 직경 섬유로 둘러싸여 있습니다. 각각 200 ㎛의 다중 모드 광섬유는 거리 화상 광섬유의 중심으로부터 864 ㎛의 중심 간 거리에 위치된다. 200 μm의 멀티 모드 섬유를 각각 25 ° 떨어져있다. '소스'섬유와 왼쪽 200 μm의 멀티 모드 광섬유 및 추가 번째를 사용하여은 "컬렉션"섬유로 200 μm의 멀티 모드 섬유를 REE,이 형상은 반드시 374 μm의 세 가지 중심 간 SDS에, 730 μm의, 1051 μm의 및 1323 μm의를 만듭니다. 섬유 팁은 섬유 상수 사이의 거리를 유지하는 원통형 금속 케이스에 동봉되어 있습니다. 통형 케이싱의 직경은 3mm이다. 광섬유 프로브 (광섬유 프로브 팁을 향해) 말단부 2 피트이다. 프로브는 4피트의 전체 길이에 대해, 추가로 2 피트이다 (계측)을 향해 기단에서 여섯 각 개개의 섬유로 분리한다. (1)는 광섬유 프로브의 표현을 나타낸다.

그림 1
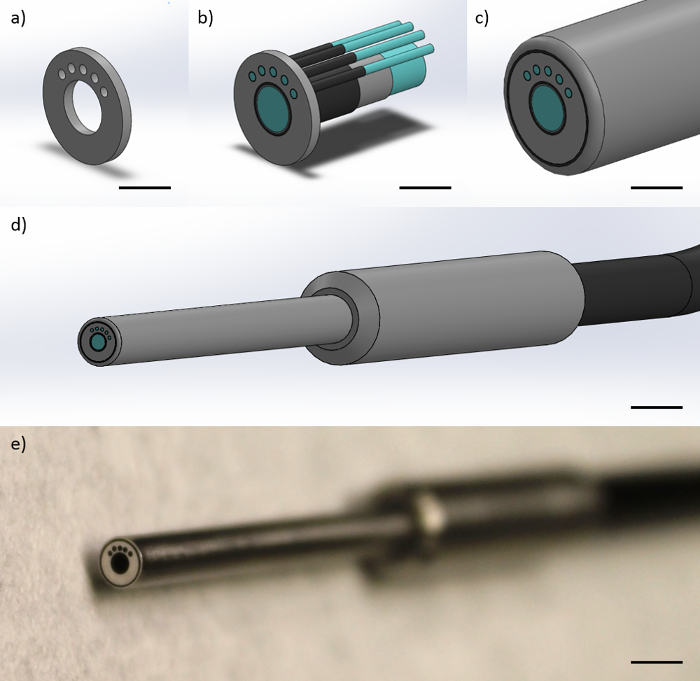
그림 1 :. 광섬유 프로브 설계 광섬유 프로브는 하나의 1mm 직경의 이미지 섬유 사 (200) μm의 멀티 모드 섬유로 구성되어 있습니다. 이그림의 표시를 나타낸다 (a) 금속 단부는 SDS의 374, 730를 수득 프로브 팁에서의 섬유의 형상을 제한 캡과 최 좌측 200 μm의 다중 모드 광섬유에 대하여 (눈금 막대 ≈ 1mm)로 1,051 ㎛의, (b) 섬유는 섬유 코어 광섬유 클래딩 및 섬유 피막 (스케일 바 ≈ 1mm), (c)의 섬유가 보호 아미드 외판 (눈금 막대 ≈ 1mm)을 보여주는 금속 캡 내에 제한되고, (d ) 금속 손잡이 모든 섬유를 포함하는 하나의 블랙 케이블 (눈금 막대 ≈ 4mm) 및 (e) 상기 프로브 (눈금 막대 ≈ 4mm의 원위 팁의 화상)와 프로브의 최종 말단 팁. 이 그림의 더 큰 버전을 보려면 여기를 클릭하십시오.

이 복합 장비 및 관련 TECHNI다른 결합 구조 / 기능 기술이 서로 다른 양식을 결합하여 존재하지만 가야는 단일 프로브 내에서 이러한 양식의 첫 번째 조합입니다. 예를 들어, 하이퍼 스펙트 럴 영상은 몇 가지 이름을 조직 단백질 발현 분석, (19)와 빛 간섭 단층 촬영 (OCT를) 결합 개발 된 정량적 인 헤모글로빈과 멜라닌 속성, 17, 18 및 다른 기술과 넓은 필드 영상을 결합한 제품입니다. 구강에서의 사용을위한 휴대용 프로브 하부 위장관 식도 또는 내시경 사용을 포함하여 다양한 목적에 최적화 될 수있는 일반적인 광섬유 프로브를 사용하여 컴팩트하고 쉬운 구현 계측 설정이 문서 보고서 외부 피부 배치. 11,20

이 기기의 하드웨어는 확산 반사 스펙트럼을 획득 한 후 결과 있습니다 volum를 추출하는 사용자 정의 데이터 수집 및 후 처리 코드가 모두 필요합니다[혈색소], [멜], 및 상 2를 포함하는 전자 평균 조직 생리 학적 매개 변수를 설정합니다. 사용자 정의 데이터 취득 코드 (고해상도 형광 현미경) 카메라로부터의 동시 획득 및 (확산 반사율 스펙트럼의 경우) 분광계 있도록 지어졌다. 드라이버들은 다양한 프로그래밍 언어와의 통합을 허용하는 제조 업체의 웹 사이트에서 사용할 수 있습니다. 사용자 지정 후 처리 코드는 생체 [혈색소]와 [멜] (21)의 사전 흡수 값을 가져 다음 스펙트럼의 장착 곡선을 생성하는 이전에 개발 된 비선형 최적화 피팅 프로세스를 사용합니다. 22 장착 곡선이을 최소화하여 구축 자체 원료 스펙트럼 사이 χ 2 값 피팅 곡선 및 낮은 χ 2 값. 22 코드로 조직 생체 변수 ([헤모글로빈], [멜, 상투 2)을 결정하는 단계를 포함하도록 수정 될 수있다이러한 여기에 사용되는 외인성 pyranine 잉크로 다른 발색단에서 흡수, 그래서 그 대상 생리 학적 매개 변수는 영향을받지 않습니다.

이러한 [헤모글로빈], [멜, 상투이 같은 조직 상태의 생리 지표는 치료 종양 반응보고 또는 로컬 혈관 형성 및 혈관 신생의 지표로서 사용될 수있다. 14,23을 고해상도 형광 microendoscopy 양상 포함 가이드 프로브 배치를 돕고 상피 조직의 구조 및 기능 사이의 관계의 더욱 완전한 그림으로 연구자를 제공한다. 이 기사, 건설 및 복합 microendoscope의 응용 프로그램에 설명되어 있습니다. (11)

Protocol

임상 시험 심사위원회의 승인 (IRB # 15-09-149)는 본 연구의 모든 측면에 대한 아칸소 대학에서 인간 주제 연구 프로그램에서 얻었다. 기재된 방법은 승인 된 가이드 라인에 따라 수행하고, 동의서 모든 참가자 얻었다. 고해상도 형광 Microendoscopy 양상 1. 총회 주 : 고해상도 형광 microendoscopy 양상의 조립체의 설명 단계는도 2에서 보여 질 수있다. </p…

Representative Results

이 프로토콜에 따라, 연구자는 뷰의 전체 필드 (도 5)로 조직 부위의 포커스에 고해상도 이미지를 얻을 것이다. 표준 노란색 형광펜에서 pyranine 잉크로 염색하는 경우 등 proflavine 등의 염료로 염색하는 경우 각각의 세포 핵을 볼 수있는 반면, 세포의 개요는, 볼 수 있습니다. 스펙트럼 수집 후, 후 처리 소프트웨어 서브 확산 반사율 스펙트럼을 맞고 [헤모글로빈…

Discussion

멀티 모달 고해상도 이미지 및 여기에보고 서브 확산 반사율 스펙트럼 섬유 다발 microendoscope 최적화 인간 또는 동물 연구 내시경 또는 휴대용 사용을 포함하여 다양한 용도 연구자에 의해 사용될 수있다. 그것은 따라서 두 개의 서로 다른 조직 깊이에서 헤모글로빈 농도, 멜라닌 농도, 조직의 산소 포화도 측정과 함께 생체 내 혀끝의 조직 마이크로 아키텍처의 시각화를위한 유?…

Disclosures

The authors have nothing to disclose.

Acknowledgements

This material is based on work supported by the National Institutes of Health (1R03-CA182052, 1R15-CA202662), the National Science Foundation Graduate Research Fellowship Program (G.G., DGE-1450079), the Arkansas Biosciences Institute, and the University of Arkansas Doctoral Academy Fellowship. Any opinions, findings, and conclusions or recommendations expressed in this material are those of the authors and do not necessarily reflect the views of the acknowledged funding agencies.

Materials

30 mm Cage Cube with Dichroic Filter Mount Thorlabs, Inc. CM1-DCH
470 nm Dichroic Mirror (Beam Splitter) Chroma Corporation T470lpxr
Cage Assembly Rod, 1.5", 4-Pack Thorlabs, Inc. ER1.5-P4
Cage Assembly Rod, 3.0", 4-Pack Thorlabs, Inc. ER3-P4
Cage Assembly Rod, 2.0", 4-Pack Thorlabs, Inc. ER2-P4
SM1-Threaded 30 mm Cage Plate Thorlabs, Inc. CP02
SM1 Series Stress-Free Retaining Ring Thorlabs, Inc. SM1PRR
SM1 Lens Tube, 1.00" Thread Depth Thorlabs, Inc. SM1L10
Right-Angle Kinematic Mirror Mount Thorlabs, Inc. KCB1
1" UV Enhanced Aluminum Mirror Thorlabs, Inc. PF10-03-F01
Z-Axis Translation Mount Thorlabs, Inc. SM1Z
10X Olympus Plan Achromatic Objective Thorlabs, Inc. RMS10X
XY Translating Lens Mount Thorlabs, Inc. CXY1
SMA Fiber Adapter Plate with SM1 Thread Thorlabs, Inc. SM1SMA
SM1 Lens Tube, 0.50" Thread Depth Thorlabs, Inc. SM1L05
440/40 Bandpass Filter (Excitation) Chroma Corporation ET440/40x
525/36 Bandpass Filter (Emission) Chroma Corporation ET525/36m
Quick Set Epoxy Loctite 1395391
455 nm LED Light Housing Kit – 3-Watt LED Supply ALK-LH-3W-KIT
1" Achromatic Doublet, f=50mm Thorlabs, Inc. AC254-050-A
Flea 3 USB Monochrome Camera Point Grey, Inc. FL3-U3-32S2M-CS
0.5" Post Holder, L = 1.5" Thorlabs, Inc. PH1.5
0.5" Optical Post, L = 4.0" Thorlabs, Inc. TR4
Mounting Base, 1" x 2.3" x 3/8" Thorlabs, Inc. BA1S
Long Lifetime Tungsten-Halogen Light Source (Vis-NIR) Ocean Optics HL-2000-LL
20X Olympus Plan Objective Edmund Optics, Inc. PLN20X
Custom-Built Aluminum Motor Arm N/A N/A Custom designed and built
Custom-Built Aluminum Motor Arm Adaptor N/A N/A Custom designed and built
Custom-Built Aluminum Motor Housing N/A N/A Custom designed and built
Stepper Motor – 400 steps/revolution SparkFun Electronics ROB-10846 Multiple suppliers
Custom-Built Aluminum Optical Fiber Switch N/A N/A Custom designed and built
Custom-Built Aluminum Optical Fiber Switch Face-Plate N/A N/A Custom designed and built
Arduino Uno – R3 SparkFun Electronics DEV-11021 Multiple suppliers
Electronic Breadboard – Self-Adhesive SparkFun Electronics PRT-12002 Multiple suppliers
EasyDriver – Stepper Motor Driver Sparkfun Electronics ROB-12779
12V, 229 mA Power Supply Phihong PSM03A Multiple suppliers
Enhanced Sensitivity USB Spectrometer (Vis-NIR) Ocean Optics USB2000+VIS-NIR-ES
550 µm, 0.22 NA, SMA-SMA Fiber Patch Cable Thorlabs, Inc. M37L01
Custom-Built Fiber-Optic Probe Myriad Fiber Imaging N/A
20% Spectralon Diffuse Reflectance Standard Labsphere, Inc. SRS-20-010
Standard Yellow Highlighter Sharpie 25005 Multiple suppliers, proflavine or fluorescein can be substituted

References

  1. Muldoon, T. J., et al. Subcellular-resolution molecular imaging within living tissue by fiber microendoscopy. Opt Express. 15, 16413-16423 (2007).
  2. Rajaram, N., Reichenberg, J. S., Migden, M. R., Nguyen, T. H., Tunnell, J. W. Pilot clinical study for quantitative spectral diagnosis of non-melanoma skin cancer. Lasers Surg Med. 42, 716-727 (2010).
  3. Louie, J. S., Richards-Kortum, R., Anandasabapathy, S. Applications and advancements in the use of high-resolution microendoscopy for detection of gastrointestinal neoplasia. Clin Gastroenterol Hepatol. 12, 1789-1792 (2014).
  4. Chang, S. S., et al. High resolution microendoscopy for classification of colorectal polyps. Endoscopy. 45, 553-559 (2013).
  5. Muldoon, T. J., et al. Noninvasive imaging of oral neoplasia with a high-resolution fiber-optic microendoscope. Head Neck. 34, 305-312 (2011).
  6. Muldoon, T. J., et al. Evaluation of quantitative image analysis criteria for the high-resolution microendoscopic detection of neoplasia in Barrett’s esophagus. J Biomed Opt. 15, 026027 (2010).
  7. Prieto, S. P., Powless, A. J., Boice, J. W., Sharma, S. G., Muldoon, T. J. Proflavine Hemisulfate as a Fluorescent Contrast Agent for Point-of-Care Cytology. PLoS One. 10, e0125598 (2015).
  8. Parikh, N., et al. In vivo diagnostic accuracy of high resolution microendoscopy in differentiating neoplastic from non-neoplastic colorectal polyps: a prospective study. Am J Gastroenterol. 109, 68-75 (2014).
  9. Shin, D., et al. Quantitative analysis of high-resolution microendoscopic images for diagnosis of esophageal squamous cell carcinoma. Clin Gastroenterol Hepatol. 13, 272-279 (2015).
  10. Prieto, S. P., et al. Qualitative and quantitative comparison of colonic microendoscopy image features to histopathology. Proc SPIE Int Soc Opt Eng. 9328, (2015).
  11. Greening, G. J., et al. Fiber-bundle microendoscopy with sub-diffuse reflectance spectroscopy and intensity mapping for multimodal optical biopsy of stratified epithelium. Biomed Opt Express. 6, 4934-4950 (2015).
  12. Rajaram, N., Gopal, A., Zhang, X., Tunnell, J. W. Experimental validation of the effects of microvasculature pigment packaging on in vivo diffuse reflectance spectroscopy. Lasers Surg Med. 42, 680-688 (2010).
  13. Spliethoff, J. W., et al. Monitoring of tumor response to cisplatin using optical spectroscopy. Transl Oncol. 7, 230-239 (2014).
  14. Chang, V. T., et al. Quantitative physiology of the precancerous cervix in vivo through optical spectroscopy. Neoplasia. 11, 325-332 (2009).
  15. Yu, B., Shah, A., Nagarajan, V. K., Ferris, D. G. Diffuse reflectance spectroscopy of epithelial tissue with a smart fiber-optic probe. Biomed Opt Express. 5, 675-689 (2014).
  16. Hennessy, R., Goth, W., Sharma, M., Markey, M. K., Tunnell, J. W. Effect of probe geometry and optical properties on the sampling depth for diffuse reflectance spectroscopy. J Biomedical Opt. 19, 107002 (2014).
  17. Ghassemi, P., Travis, T. E., Moffatt, L. T., Shupp, J. W., Ramella-Roman, J. C. A polarized multispectral imaging system for quantitative assessment of hypertrophic scars. Biomed Opt Express. 5, 3337-3354 (2014).
  18. Vasefi, F., et al. Polarization-sensitive hyperspectral imaging in vivo: a multimode dermoscope for skin analysis. Sci Rep. 4, (2014).
  19. Winkler, A. M., Rice, P. F. S., Drezek, R. A., Barton, J. K. Quantitative tool for rapid disease mapping using optical coherence tomography images of azoxymethane-treated mouse colon. J Biomedl Opt. 15, 041512 (2010).
  20. Bish, S. F., et al. Handheld Diffuse Reflectance Spectral Imaging (DRSi) for in-vivo characterization of skin. Biomed Opt Express. 5, 573-586 (2014).
  21. Prahl, S. A. . Optical Absorption of Hemoglobin. , (1999).
  22. Rajaram, N., et al. Design and validation of a clinical instrument for spectral diagnosis of cutaneous malignancy. Appl Opt. 49, 142-152 (2010).
  23. Hennessy, R., Markey, M. K., Tunnell, J. W. Impact of one-layer assumption on diffuse reflectance spectroscopy of skin. J Biomed Opt. 20, 27001 (2015).
  24. Rajaram, N., Nguyen, T. H., Tunnell, J. W. Lookup table-based inverse model for determining optical properties of turbid media. J Biomed Opt. 13, 050501 (2008).
  25. Nichols, B. S., Rajaram, N., Tunnell, J. W. Performance of a lookup table-based approach for measuring tissue optical properties with diffuse optical spectroscopy. J Biomed Opt. 17, 057001 (2012).
  26. Greening, G. J., James, H. M., Muldoon, T. J. . Optical Phantoms: Diffuse and Sub-diffuse Imaging and Spectroscopy Validation. , 1-37 (2015).
  27. Karsten, A. E., Smit, J. E. Modeling and verification of melanin concentration on human skin type. Photochem Photobiol. 88, 469-474 (2012).
  28. Glennie, D. L., Hayward, J. E., Farrell, T. J. Modeling changes in the hemoglobin concentration of skin with total diffuse reflectance spectroscopy. J Biomed Opt. 20, 035002 (2015).
  29. Lim, L., Nichols, B., Rajaram, N., Tunnell, J. W. Probe pressure effects on human skin diffuse reflectance and fluorescence spectroscopy measurements. J Biomed Opt. 16, 011012 (2011).
check_url/54564?article_type=t

Play Video

Cite This Article
Greening, G. J., Rajaram, N., Muldoon, T. J. Multimodal Imaging and Spectroscopy Fiber-bundle Microendoscopy Platform for Non-invasive, In Vivo Tissue Analysis. J. Vis. Exp. (116), e54564, doi:10.3791/54564 (2016).

View Video