This paper introduces the method of developing, characterizing, and tracking in real-time the tumor metastasis in zebrafish model of neuroblastoma, specifically in the transgenic zebrafish line with overexpression of MYCN and LMO1, which develops metastasis spontaneously.
Method Article
Zebrafish Model of Neuroblastoma Metastasis
In This Article
Summary
Abstract
Zebrafish has emerged as an important animal model to study human diseases, especially cancer. Along with the robust transgenic and genome editing technologies applied in zebrafish modeling, the ease of maintenance, high-yield productivity, and powerful live imaging altogether make the zebrafish a valuable model system to study metastasis and cellular and molecular bases underlying this process in vivo. The first zebrafish neuroblastoma (NB) model of metastasis was developed by overexpressing two oncogenes, MYCN and LMO1, under control of the dopamine-beta-hydroxylase (dβh) promoter. Co-overexpressed MYCN and LMO1 led to the reduced latency and increased penetrance of neuroblastomagenesis, as well as accelerated distant metastasis of tumor cells. This new model reliably reiterates many key features of human metastatic NB, including involvement of clinically relevant and metastasis-associated genetic alterations; natural and spontaneous development of metastasis in vivo; and conserved sites of metastases. Therefore, the zebrafish model possesses unique advantages to dissect the complex process of tumor metastasis in vivo.
Introduction
Zebrafish has been widely used and applied to several areas of research, especially in cancer. This model provides many advantages-such as its robust reproduction, cost-effective maintenance, and versatile visualization of tumor growth and metastasis-all of which make zebrafish a powerful tool to study and investigate the cellular and molecular bases of tumorigenesis and metastasis. New techniques for large-scale genome mapping, transgenesis, genes overexpression or knockout, cell transplantation, and chemical screens have immensely augmented the power of the zebrafish model1. During the past few years, many zebrafish lines have been developed to study tumorigenesis and metastasis of a variety of human cancers, including but not limited to leukemia, melanoma, rhabdomyosarcoma, and hepatocellular carcinoma2,3,4,5. Additionally, the first zebrafish model of neuroblastoma (NB) was generated by overexpressing MYCN, an oncogene, in the peripheral sympathetic nervous system (PSNS) under control of the dopamine-beta-hydroxylase (dβh) promoter. With this model, it was further demonstrated that activated ALK can synergize with MYCN to accelerate tumor onset and increase tumor penetrance in vivo6.
NB is derived from the sympathoadrenal lineage of the neural crest cells, and is a highly metastatic cancer in children7. It is responsible for 10% of pediatric cancer-related deaths8. Widely metastasized at diagnosis, NB can be clinically presented as tumors primarily originating along the chain of the sympathetic ganglia and the adrenal medulla of PSNS9,10. MYCN amplification is commonly associated with poor outcomes in NB patients11,12. Moreover, LMO1 has been identified as a critical NB susceptibility gene in high-risk cases13,14. Studies found that the transgenic coexpression of MYCN and LMO1 in the PSNS of the zebrafish model not only promotes earlier onset of NB, but also induces widespread metastasis to the tissues and organs that are similar to sites commonly seen in patients with high-risk NB13. Very recently, another metastatic phenotype of NB has also been observed in a newer zebrafish model of NB, in which both MYCN and Lin28B, encoding an RNA binding protein, are overexpressed under control of the dβh promoter16.
The stable transgenic approach in zebrafish is often used to study whether overexpression of a gene of interest could contribute to the normal development and disease pathogenesis14,15. This technique has been successfully used to demonstrate the importance of multiple genes and pathways to NB tumorigenesis6,16,17,18,19,20. This paper will introduce how the transgenic fish line that overexpresses both MYCN and LMO1 in the PSNS was created and how it was demonstrated that the cooperation of these two oncogenes accelerate the onset of NB tumorigenesis and metastasis13. First, the transgenic line that overexpresses EGFP-MYCN under control of the dβh promoter (designated MYCN line) was developed by injecting the dβh-EGFP-MYCN construct into one-cell stage of wild-type (WT) AB embryos, as previously described6,17. A separate transgenic line that overexpresses LMO1 in the PSNS (designated LMO1 line) was developed by coinjecting two DNA constructs, dβh-LMO1 and dβh-mCherry, into WT embryos at the one-cell stage13. It has been previously demonstrated that coinjected double DNA constructs can be cointegrated into the fish genome; therefore, LMO1 and mCherry are coexpressed in the PSNS cells of the transgenic animals. Once the injected F0 embryos reached sexual maturity, they were then out-crossed with WT fish for the identification of positive fish with transgene(s) integration. Briefly, the F1 offspring were first screened by fluorescent microscopy for mCherry expression in the PSNS cells. The germline integration of LMO1 in mCherry-positive fish was further confirmed by genomic PCR and sequencing. After successful identification of each transgenic line, the progeny of heterozygous MYCN and LMO1 transgenic fish were interbred to generate a compound fish line expressing both MYCN and LMO1 (designated MYCN;LMO1 line). Tumor-bearing MYCN;LMO1 fish were monitored by fluorescent microscopy biweekly for the evidence of metastatic tumors in the regions distant to the primary site, interrenal gland region (IRG, zebrafish equivalent of human adrenal gland)13. To confirm the metastasis of tumors in MYCN;LMO1 fish, histological and immunohistochemical analyses were applied.
Protocol
All research methods using zebrafish and animal care/maintenance were performed in compliance with the institutional guidelines at Mayo Clinic.
1. Preparation and microinjection of transgene constructs for the development of LMO1 transgenic zebrafish line with overexpression in PSNS
- To develop the LMO1-pDONR221 entry clone, amplify the coding region of human LMO1 from cDNA obtained from human cell line using PCR.
- Make a 25 µL reaction as detailed here: 2.5 µL of 10x standard Taq Reaction Buffer, 0.125 µL of Taq DNA Polymerase, 0.5 µL of 10 mM dNTPs, 2 µL of cDNA template, 0.5 µL of 10 µM forward LMO1 ATTB1 primer, 0.5 µL of 10 µM reverse LMO1 ATTB2 primer, and 18.875 µL of water.
NOTE: Use forward LMO1 ATTB1 primer: 5'-GGGGACAAGTTTGTACAAAAAAGCAGGCTACAC-3'.
CATGATGGTGCTGGACAAGGAGGA-3' and reverse LMO1 ATTB2 primer: 5'-GGGGACCACTTTGTACAAGAAAGCTGGGTTTACT
GAACTTGGGATTCAAAGGT-3' - Amplify using the following program: 1 cycle of 94 °C, 2 min; followed by 30 cycles of (94 °C, 30 s, 55 °C, 30 s, 72 °C, 1 min) and 72 °C, 7 min.
- Make a 25 µL reaction as detailed here: 2.5 µL of 10x standard Taq Reaction Buffer, 0.125 µL of Taq DNA Polymerase, 0.5 µL of 10 mM dNTPs, 2 µL of cDNA template, 0.5 µL of 10 µM forward LMO1 ATTB1 primer, 0.5 µL of 10 µM reverse LMO1 ATTB2 primer, and 18.875 µL of water.
- Clone LMO1 PCR product into the pDONR221 gateway donor vector by BP recombinase reaction6,13 (PCR fragment + Donor vector = Entry Clone).
- For a 10 µL reaction, mix 1 µL of purified LMO1 PCR product (150 ng/µL), 1 µL (150 ng/µL) pDONR221 donor vector, and 6 µL of TE buffer (pH 8.0) with 2 µL of BP enzyme mix, incubate for 1 h at 25 °C, and transform to TOP10 competent E. coli using the manufacturer's protocol.
- Next, spread 50-200 µL from the transformation vial on a Luria Broth (LB) agar plate containing 50 µg/mL kanamycin and incubate at 37 °C overnight.
- Select clones by inoculating a single colony into 2-5 mL of LB with 50 µg/mL kanamycin and culturing overnight (16-18 h) at 37 °C.
- Use 2 mL of overnight bacterial culture for plasmid isolation according to the manufacturer's protocol. To verify the LMO1 plasmid, send plasmid sample out for sequencing with M13-F primer (5- GTAAAACGACGGCCAG-3').
- To generate a dβh-pDONRP4-P1R entry clone, obtain dβh PCR product6,13 by amplifying the 5.2-kb promotor region using the CH211-270H11 BAC clone as template to prepare a 20 µL reaction as previously described in step 1.1.1. Use the following PCR program parameters: 94 °C, 2 min; 10 cycles of 94 °C, 15 s, 50 °C, 30 s, 68 °C, 8 min; 30 cycles of 94 °C, 15 s, 53 °C, 30 s, 68 °C, 8 min; 68 °C, 4 min (with forward primer 5'GGGGACAACTTTGTATAGAAAAGTTGGCGTACTC
CCCCTTTTTAGG-3' and reverse primer 5'-GGGGACTGCTTTTTTGTACAAACTTGTGTTGCTTTG
TCGTCTTTTGA-3').
NOTE: Due to the long DNA templates in this step, ensure usage of an appropriate PCR system for accurate PCR amplification. - Clone dβh PCR product into the pDONRP4-P1R gateway donor vector by BP recombinase reaction6,13 (PCR fragment + Donor vector = Entry Clone).
- Mix 1 µL of purified dβh PCR product (172 ng/uL), 1 µL (150 ng/µL) of pDONRP4-P1R donor vector, and 6 µL of TE buffer (pH 8.0) with 2 µL of BP enzyme mix in a total of 10 µL reaction, incubate for 1 h at 25 °C.
- Transform to TOP10 competent E. coli according to the manufacturer's protocol. Isolate the plasmid as described in steps 1.2.2-1.2.4 and verify plasmid by sequencing with M13-F (5'-GTAAAACGACGGCCAG-3') and M13-R (5'-CAGGAAACAGCTATGAC-3') primers.
- Generate the dβh:LMO1 expression construct.
- Combine 1 µL of each entry clone (dβh-pDONRP4-P1R, LMO1-pDONR221 and p3E-polyA11) (20 fmole each), 1 µL (60 ng/µL) of modified destination vector with I-SceI recognition sites, and 4 µL of TE buffer (pH 8.0) containing 2 µL of the LR recombinase enzyme mix. Incubate this mixture for 1 h at 25 °C.
- While following the manufacturer's protocol, transform bacteria to chemically competent TOP10 E. coli. Isolate plasmid as described in steps 1.2.2-1.2.4 and verify plasmid by sequencing with DBH Forward (5'-GAAGCTGTCACAGGGTTGTG-3') and LMO1 (5'-GGCATTGGACAAGTACTGGCA-3') primers.
- Generate dβh:mCherry DNA construct with a gateway system by combining entry clones of a 5.2-kb dβh promoter, pME-mCherry, and p3E-polyA into the modified destination vector containing I-SceI recognition sites as mentioned previously in step 1.5.16. Isolate plasmid as described in steps 1.2.2-1.2.4 and verify plasmid by sequencing with DBH Forward primer (5'-GAAGCTGTCACAGGGTTGTG-3').
- Linearize dβh:LMO1 DNA construct and dβh:mCherry DNA construct (at a 3:1 ratio, respectively) in a total of a 15 µL reaction volume with 1 µL of I-SceI enzyme (5 U/µL) and 0.75 µL of buffer (10x), and incubate at room temperature for a minimum of 4 h or overnight. Ensure that DNA concentration does not exceed 750 ng in reaction.
- Next day and after linearization of constructs, add 0.5 µL of fresh I-SceI enzyme (5 U/µL) and 0.5 µL of 0.5% phenol red into 5 µL of total DNA mixture from previous step of 1.7. Microinject the total solution (of 50-80 pg of linearized DNA) into one-cell-stage wild-type AB embryos (and as many as 500 embryos) using 1.0 mm diameter glass micropipette needle as previously described17. Store the remaining DNA mixture at -20 °C for future injections.
2. Screen and verify LMO1 transgenic fish line for germline transmission of LMO1 and mCherry
- At 3-4 days-post-fertilization (dpf), anesthetize injected embryos with 0.02% tricaine and screen them for fluorescent mCherry expression, which presents anywhere throughout the fish body due to the mosaic transgenesis. Transfer mCherry-positive embryos into a Petri dish with fresh egg water and raise embryos to sexual maturity in accordance with the zebrafish book21.
NOTE: Expect the ratio of positive fish to vary depending on the expertise and experience of research personnel. For example, beginning amateurs may have a low integration rate of 10%, compared to an expert's of ≥50%. - To determine the founder fish with dβh:LMO1 and dβh:mCherry transgenes integrated into germ cells, outcross single pairs of injected mCherry-positive F0 sexually matured fish from previous step (2.1) with WT AB fish. Screen the F1 generation for mCherry-positive embryos at 3-4 dpf.
- To confirm that the mCherry-positive fish carry LMO1 transgene, isolate the gDNA from F1 mCherry-positive single embryo using the gDNA extraction buffer, which contains: 12.5 µL of 4x lysis buffer (500 µL of 1 M Tris with pH of 8.4, 2.5 mL of 1 M potassium chloride, and 47 mL of purified water), 35 µL of purified water, and 2.5 µL of proteinase K at 10 mg/mL. Incubate the sample for 16 h at 55 °C, followed by 10 min at 98 °C.
- Use the extracted gDNA (2 µL) as a template for the genotyping PCR with primers: LMO1 FW: 5'-GGCATTGGACAAGTACTGGCA -3' and LMO1 RV: 5'-CGAAGGCTGGGATCAGCTTG -3', and the following PCR program: 1 cycle of 94 °C, 10 min; 35 cycles of (94 °C for 30 s, 60 °C for 30 s; 68 °C, 30 s); and 68 °C for 7 min. Confirm the amplified 182 bp fragment by sequencing.
- After confirmation of the genotype, raise the remaining mCherry-positive F1 embryos to maturity in accordance with the standard guidelines of the zebrafish book21. Fin clip and genotype them at 2-3 months of age using steps 2.3-2.4 from the protocol above to further confirm the integration of the LMO1 transgene in the fish.
NOTE: The LMO1-positive F1 fish will be the stable transgenic fish [Tg(dβh:LMO1),Tg(dβh:mCherry)] (designated as LMO1 line). - Breed F1 LMO1 stable transgenic fish with WT fish and repeat as needed to propagate this line.
3. Outcross of LMO1 and MYCN transgenic lines to create metastatic model
- Once the LMO1 transgenic zebrafish line is generated, interbreed with MYCN line6,17 to develop heterozygous transgenic fish line overexpressing both MYCN and LMO1.
- At 1 dpf, sort the progeny of outcross for EGFP expression with stereoscopic fluorescence microscope, which presents as EGFP-positive points in the hindbrain region.
NOTE: Alternatively, if not all embryos are sorted for MYCN at 1 dpf, raise the embryos to adulthood and genotype by fin clipping and using formerly stated guidelines from steps 2.3-2.4 for gDNA isolation and PCR genotyping, with primers: MYCN-F (5'-ATT CAC CAT CAC TGT GCG TCC-3'); MYCN-R (5'-TGC ATC CTC ACT CTC CAC GTA-3', and the following program with standard Taq polymerase: 1 cycle of 94 °C for 3 min, 35 cycles of (94 °C for 30 s, 60 °C for 30 s, and 68 °C for 3 min), and 68 °C for 7 min with expected amplicon size of 145 bp. - After sorting for EGFP at 1 dpf, isolate screened embryos into separate Petri dishes and label dishes as: MYCN+ (EGFP-positive) or MYCN- (EGFP-negative).
- At 3-4 dpf, visualize and sort embryos of both groups (step 3.3) for LMO1 expression with a stereoscopic fluorescence microscope. Look for red fluorescent protein expression as spots in both the superior cervical ganglion and non-PSNS dopaminergic neuronal cells in the head region, especially in oblongata medulla of the hindbrain6,13.
NOTE: Screen for mCherry/LMO1 before embryos reach 5 dpf, because air-filled swim bladders fully develop by then and will cause the embryos to float, resulting in difficult microscopic focusing of the PSNS cells during the sorting process. - Once sorting is completed, isolate sorted fish into four groups of different genotypes and label as below. Raise the sorted fish in identical conditions according to the standard protocols from the zebrafish book21.
- MYCN-only (EGFP-positive),
- LMO1-only (mCherry-positive),
- MYCN; LMO1 (EGFP and mCherry double positive),
- WT (EGFP and mCherry double negative).
4. Visualizing tumor burden in transgenic zebrafish lines
- At 4 weeks-post-fertilization (wpf), anesthetize sorted fish from step 3.5 with 0.02% tricaine in a petri dish.
- Visualize tumors with a stereoscopic fluorescence microscope by gently flipping fish with a metal spatula onto both lateral sides to view tumor. Expect tumors to present as single EGFP-, single mCherry-, or double EGFP-and-mCherry-positive masses that arise from the interrenal gland region (near head and kidney).
NOTE: It is possible that the initial tumor onset is typically presented with a brighter and larger fluorescence positive mass on one side of interrenal gland, which is why it is crucial to visualize both sides of fish to avoid missing early tumor onset. - After identification of the possible tumor-bearing fish, isolate fish into a separate tank with appropriate labels, which includes date of birth, date when tumor screened, and genotype.
- At 6 wpf, repeat previous steps 4.1-4.3 to screen tumor-bearing fish and non-tumor bearing fish again to confirm the presence of tumors for previously screened tumor-bearing fish or identify new possible tumor-bearing fish, respectively. Look for sustained or increased size of fluorescence-positive mass in confirmed tumor-bearing fish.
- After identifying tumor-bearing fish, monitor them biweekly for evidence of tumor cell migration, which presents as tiny EGFP- and/or mCherry-positive tumor masses far from the primary site of tumorgenesis (interrenal gland region). Isolate these fish into separate tanks as needed and label appropriately to indicate possible metastasis.
- To further confirm the metastasis, continue tracking these fish regularly (every two weeks) until the distant fluorescence-positive tumor masses show clearly increased size, indicating growth of tumors in the metastatic sites.
5. Tissue processing and paraffin sectioning of tumor-bearing fish
NOTE: Perform this step to characterize the spontaneously developed primary and/or metastatic tumors in MYCN and MYCN;LMO1 transgenic fish.
- After identification and verification of tumor-bearing fish, sacrifice fish from step 4.6 in a Petri dish by submerging fish in 0.02% tricaine to anesthetize first and then increasing tricaine dosage until fish is no longer respiring. Cut the fish into two pieces-with one piece containing the head and a portion of the body's middle section (including tumor), and another piece with the rest of the fish's middle section and tail.
- Fix both fish sections with 4% paraformaldehyde (PFA) in 1x PBS for 1 h at room temperature on a rocker. To enhance fixation efficiency, replace buffer with fresh 4% PFA to increase penetrance to the internal organs effectively and quickly. Leave fish with fresh fixing buffer on a rocker at 4 °C overnight or for 48 h.
CAUTION: PFA is toxic. Since precautionary procedures and proper disposal of reagent depends on the regulations of your institution, seek proper guidelines before using and disposal of reagent. - Prior to the processing, place sample(s) in 100% rapid decalcifier solution for 15-20 min at room temperature. Make sure to use a nonmetal container and to check sample(s) throughout incubation to prevent over decalcification. If sample tissue looks heavily degraded, place sample in water or at 4 °C to slow down the decalcification process.
- Once fixed and decalcified, wash fish sample(s) with running tap water for 1 h and place it into processor cassette(s). If there is more than one sample, separate each into its own cassette.
- Dehydrate and prepare the tissue for paraffin embedding by placing cassette(s) with fish into the tissue processor where the sample(s) are submerged in various solutions, respectively, as follows: 70% ethanol (60 min, 40 °C), 85% ethanol (50 min, 40 °C), 95% ethanol (40 min, 40 °C) twice, 100% ethanol (30 min, 40 °C), another fresh solution of 100% ethanol (50 min, 40 °C) twice, xylene (30 min, 40 °C), another fresh solution of xylene (50 min, 40 °C), another fresh xylene (50 min, 45 °C), paraffin (30 min, 45 °C), paraffin (20 min, 58 °C) three times.
- After the tissue is processed, unload the cassette(s) from the processor machine while maintaining organization of each cassette and making sure to prevent mixing up the fish samples.
- Choose the appropriate sized mold based on the size of the fish, making sure the mold will fit the entire cassette with the fish sample. Cover the bottom of the mold with liquid paraffin at 60 °C.
- Immediately place cassette with the fish on top of mold (making sure the fish is laid on its flat lateral side for sagittal sections) with liquid paraffin, and finish filling with paraffin to the top of the mold to completely embed the fish.
- Place the completed mold on the cold plate of the sectioning microtome until the paraffin is hardened.
- Once the paraffin block is hard, which can be judged by visually observing higher opacity and a firm touch to the block, gently remove the block from the mold. Carefully scrape off any excess paraffin from the sides of the cassette.
- Section the paraffin-embedded fish block sagittally at 4 microns on the microtome and float the sections on a warm water bath at 40 °C containing distilled water.
- Carefully transfer the sections onto positively charged slides and bake in oven at 60 °C for 30 min prior to staining before proceeding to either step 6, 7, or 8.
6. Hematoxylin and eosin (H&E) staining of paraffin sections for pathology review
- Place slides containing paraffin sections from step 5.12 into a slide holder. Inside a chemical fume hood, deparaffinize with xylene 3 times, 5 min each. Discard solution after each use.
- Rehydrate sections with 100% ethanol for 3 min, and repeat twice with fresh 100% ethanol. Replace 100% ethanol with 95% ethanol for 3 min and then, 80% ethanol for 3 min.
- Rinse sections with distilled water for 5 min. While the sections are washing in water, make sure to remove oxidized particles from hematoxylin by either filtering or skimming surface of hematoxylin with a lint-free wipe.
- Blot the excess water from the slide holder with lint-free professional grade wipes, and stain slides in 50% hematoxylin (1:1 dilution with distilled water) for 2-5 min depending on desired staining preference and reagent deterioration. Discard hematoxylin when solution color changes from plum to blue/brown or when staining time becomes excessive. Rinse the slides with running tap water for 20 min.
- Decolorize the sections in 1% acid ethanol (3.3 mL of Hydrochloric acid with 50 mL of 70% ethanol) by quickly dipping the slides multiple times. Slides can be dipped up to 3 s, but the longer the slides are dipped, the lighter the sections become.
- Rinse the slides in tap water twice for 1 min each, and once with deionized water. As an option, slides can be left overnight at this stage, soaking in water.
- Immerse the sections in 1.36% lithium carbonate solution (47 g lithium carbonate, 3500 mL water) for 3 s. Make sure not to over incubate the sections since the longer the time in lithium carbonate solution, the more likely the tissue will float.
- Rinse the sections in tap water for 5 min, and blot the excess water from the slide holder with lint-free professional grade wipes.
- Counterstain the slides in 100% ready-to-use eosin for 15-30 s, and immediately dehydrate with 95% ethanol twice for 5 min each. Replace with 100% ethanol twice for 5 min each, discarding the solutions after each use.
- Clear the sections in xylene for 15 min and repeat twice for 3 times in total. Optionally, the slides can be left in xylene overnight at room temperature to better clear excess water.
- Allow the slides to air dry in the chemical fume hood and then mount a cover slip using mounting medium to seal tissue sample.
- Visualize and image the stained tissue sections under microscopy. Carefully examine the tumors at the primary site (the interrenal gland region in head kidney) and the distant sporadic metastases in other tissues and organs of the fish. Send out stained slides for tissue sections to be reviewed by pathologists. Based on the fish model's similar pathological features to human neuroblastoma, expect the tumors that arose in MYCN-only or MYCN;LMO1 fish to be first diagnosed as neuroblastoma by pathologists.
7. Immunohistochemical Analysis (IHC) with antibodies against NB marker and overexpressed transgenes to further confirm the spread of tumor and their sympathoadrenal lineage property
- Staining with fully automatic staining system
- To better compare the IHC result with that of H&E staining, select adjacent slides from step 5.12 for IHC staining.
NOTE: Although an automated staining system allows for faster and less laborious results, a manual protocol for IHC staining can be used in the absence of such by referring to steps of subsection 7.2. - Dilute the primary antibody against tyrosine hydroxylase (TH) (1:500), a neuroblastoma marker, based on desired concentration and total amount needed with the automated system's corresponding Primary Antibody Diluent.
NOTE: Optimal antibody concentrations may vary depending on antibody and tissue. - Since the automated system uses onboard heat-induced antigen retrieval with epitope retrieval solution for 20 min and the system's corresponding detection reagent, ensure the parameters for the machine are set as: Peroxidase Blocking, 5 min; Primary antibody with desired concentration, 15 min; biotinylated anti-rabbit IgG secondary antibody (1:500), 8 min; Streptavidin HRP, 8 min; mixed DAB intense substrate, 5 min; and Hematoxylin, 5 min.
- Once the settings are set, place the antibody tray into the machine. Set up the slides by creating a new case, which will label the slides. The machine is now loaded and ready to run (dewaxing, staining, and counterstaining).
- Once the slides are dewaxed, stained, and counterstained using the automated machine, dehydrate the slides in ethanol gradients of 70%, 95%, and 100% for 5 min each. Submerge slides of sections in 100% fresh ethanol again for 5 min.
- Clear the sections in xylene for 5 min, twice, or leave slides in xylene overnight to better clear excess water.
- Allow the slides to air dry in the chemical fume hood and then mount a cover slip using a mounting medium. Visualize and image the stained tissue sections with microscopy.
- To firmly confirm metastasis in the fish model, compare the slides stained with antibodies against neuroblastoma marker from step 7 to those stained by H&E from step 6.
NOTE: Expect to see positive staining for neuroblastoma marker, TH, in all tumor cells identified by H&E staining. Also expect no positive staining for TH in adjacent tissues where the metastatic tumors were identified in LMO1;MYCN fish. Make sure to select control WT and MYCN-only fish that are of similar age to MYCN;LMO1 fish for this analysis to rule out the possibility that the metastatic tumors are multifocal primary tumors.
- To better compare the IHC result with that of H&E staining, select adjacent slides from step 5.12 for IHC staining.
- Manually staining without automated IHC staining system
- After the slides are baked, select adjacent slides from step 5.12 to allow better comparison between H&E and IHC staining to deparaffinize. Inside a chemical fume hood, dewax and rehydrate the slides with xylene using previous steps 6.1 and 6.2., respectively.
- After deparaffinization and rehydration, soak slides in endogenous peroxide blocking solution (1x PBS containing 0.1% sodium azide and 0.3% hydrogen peroxide) for 5 min at room temperature. Wash slides in fresh 1x PBS for 3 min and repeat twice for a total of 3 times.
CAUTION: Sodium azide is acutely toxic. Ensure to practice precautionary procedures and proper disposal of reagent depending on the regulations of your institution. - Retrieve antigen by incubating slides in solution with proteinase K (1:500 in 1x PBS) for 10 min at room temperature. Wash slides 3 times with 1x PBS for 3 min each.
- Block slides by incubating with 5% goat serum in 1x PBS for 30 min at room temperature on rocker. Wash slides with fresh 1x PBS twice for 3 min each.
- Add 4 drops of Avidin blocking solution directly onto slide and incubate for 15 min at room temperature. After washing slides with fresh 1x PBS twice for 3 min each, add 4 drops of Biotin blocking solution and incubate at room temperature for 15 min.
- After blocking slides, incubate in primary antibody of tyrosine hydroxylase (TH) (1:500) for 45-60 min at room temperature, or overnight at 4 °C.
NOTE: Stain with additional antibodies against transgenes and other relevant markers to address physiology and activity of primary tumor and other metastatic sites. Optimal antibody concentrations may vary depending on antibody and tissue. - Wash slides with fresh 1x PBS for 3 min, repeating twice with a total of 3 times.
- Incubate slides in secondary antibody of biotinylated anti-rabbit IgG secondary antibody (1:500) diluted in blocking solution for 45-60 min at room temperature. Repeat previous washing step 7.2.7.
- Add HRP conjugated Avidin (1:300 in 1x PBS), and incubate for 20 min at room temperature. Wash slides 3 times with fresh 1x PBS for 5 min each.
- Prepare 3,3’-Diaminobenzidine (DAB) solution (2.5 mL distilled water, 1 drop of kit buffer, 1 drop of hydrogen peroxide, and 2 drops of DAB from kit), and place drops of DAB directly onto slides near a microscope. After adding DAB, observe the color change reaction on the slides under microscope. Once desired staining intensity is reached, stop reaction by placing slide sections in cold distilled water.
- Counterstain the slides with fresh 50% hematoxylin by submerging or dipping samples for a few short seconds and placing back into distilled water. Repeat as desired, but normally, once should be enough since tissue sections are thin.
- Dehydrate tissue samples on slides in alcohol gradient as previously described in step 7.1.5 and continue through the remaining steps (with the last step as 7.1.8) to finish the IHC analysis.
8. Picrosirius red staining of paraffin slides for collagen accumulation in tumors as mechanism study
- Repeat steps 6.1-6.3 to dewax, hydrate, and wash paraffin sections on slides.
- After blotting the excess water from the slide holder with professional grade lint-free wipes, stain in 50% hematoxylin for 10 min. Rinse the slides with running tap water for 10 min.
- Transfer the slides into Picrosirius Red and incubate at room temperature for 1 h.
- Wash the slides in acidified water (5 mL glacial acetic acid in 1 L of tap or distilled water) twice, incubating for 5 min on shaker.
- Decant most of the water from slides first before physically shaking and blotting sections on slides to remove as much water as possible.
- Quickly place slides into three changes of 100% ethanol to dehydrate paraffin sections.
- Repeat steps 6.10 and 6.11 to clear slides in xylene and mount sample. Next, image with compound microscope that is equipped with a camera.
- Using ImageJ, count the picrosirius red-positive collagen fibers in at least three random fields for each section. Compare between slides of MYCN and MYCN;LMO1 fish sections.
Results
To determine whether LMO1 synergizes with MYCN to affect NB pathogenesis, transgenic constructs that drive expression of either LMO1 (dβh:LMO1 and dβh:mCherry) or MYCN (dβh:EGFP-MYCN) in the PSNS cells under control of the dβh promoter were injected into zebrafish embryos13. As illustrated in Figure 1A, after the development of stable transgenic lines and validation of their genotypes, heterozygous MYCN and LMO1 fish were interbred. Their offspring were sorted for MYCN (EGFP+) or LMO1 (mCherry+) expression at 1 dpf or 3-4 dpf, respectively. MYCN overexpression has been shown to suppress PSNS development6. Thus, the EGFP-MYCN expression is more prominent in the non-PSNS dopaminergic neuronal cells at 1 dpf6, such as the cranial ganglia (CA), arch-associated catecholaminergic neurons (AAC), and medulla oblongata (MO). Due to the instability of EGFP-MYCN protein, the EGFP signal becomes dimmer after 2 days. In contrast, the mCherry expression is prominent in both PSNS cells, such as the superior cervical ganglion and non-PSNS dopaminergic neuronal cells, which includes CA, AAC, and MO, from 3 dpf and onwards6. Hence, the offspring of MYCN and LMO1 mating are sorted at 1 dpf for MYCN (EGFP+) and at 3 dpf for LMO1 (mCherry+). The sorted fish were separated into different genotypic groups, as follows: i) MYCN, ii) LMO1, iii) MYCN;LMO1, and iv) WT, and raised in the identical conditions. Beginning at 4 wpf, the offspring were screened biweekly for the evidence of tumors by fluorescent microscopy. Fluorescent positive tumor masses were detected in the tissues and organs distant from the primary tumor site in the compound transgenic fish with overexpression of both MYCN and LMO1, but not in the transgenic fish with expression of MYCN alone (Figure 1B).
To further verify the metastasis in these transgenic animals, tumor-bearing MYCN and MYCN;LMO1 transgenic fish at 5 to 9 months of age were subjected for paraffin sectioning and immunohistochemical analyses with an antibody against the neuroblastoma marker, TH. The representative results for a MYCN;LMO1 fish is presented in Figure 2. H&E staining of the sagittal sections showed that the primary tumor arose from the interrenal gland region, the zebrafish equivalent of the human adrenal gland, which is the most common site of primary disease in neuroblastoma patient12,22 (Figures 2A,B). Composed of tiny, undifferentiated, and round cancerous cells with hyperchromatic nuclei, the tumor often formed layers that were histologically similar to the human neuroblastomas as described previously6 (Figures 2A,B). Consistent with the observation by fluorescent microscopy (Figure 1B), widespread tumor masses distant from the inter-renal gland were detected in multiple regions, including: distal portion of the kidney (the primary adult hematopoietic niche of zebrafish and comparable to the mammalian bone marrow23) (Figure 2A,C), orbit (Figures 2A,D), gill (analogous to the mammalian lung24) (Figures 2A,E), spleen (analogous to the mammalian lymph node25) (Figure 2A and 2F) and inner wall of atrial chamber of heart (Figures 2G). Many of these metastases recapitulate the common sites of metastases seen in patients with high-risk neuroblastoma, which include the bone marrow, lymph node, orbit region and lung13,23,24,25. Further immunohistochemistry with the antibody against TH confirmed the PSNS neuroblast lineage of tumor cells at the primary tumor and all the metastatic sites (Figures 2H-M).
In an effort to better understand the mechanisms underlying the synergy between MYCN and LMO1 in accelerating tumor metastatic spread, it was discovered that the expression levels of a panel of genes involved in tumor cell to extracellular matrix interaction were significantly elevated in the fish tumors with overexpression of both MYCN and LMO113. To examine whether the extracellular matrix was indeed affected by the altered gene expression in LMO1-overexpressing tumors leading to enhanced tumor dissemination or migration, the paraffin sections from MYCN-only and MYCN;LMO1 tumors were stained with Picrosirius red (PSR), a highly selective stain for collagen fibers, to assess collagen deposition and extracellular matrix (ECM) stiffness26,27. As demonstrated in Figure 3A-E, there were significantly amplified amounts and increased thickness of PSR-stained collagen fibers found in MYCN;LMO1 tumors, when compared to the tumors only expressing MYCN alone. Together, these results demonstrate that the overexpression of LMO1 can remodel the tumor ECM to increase its stiffness, and therefore, facilitating tumor cell dissemination.
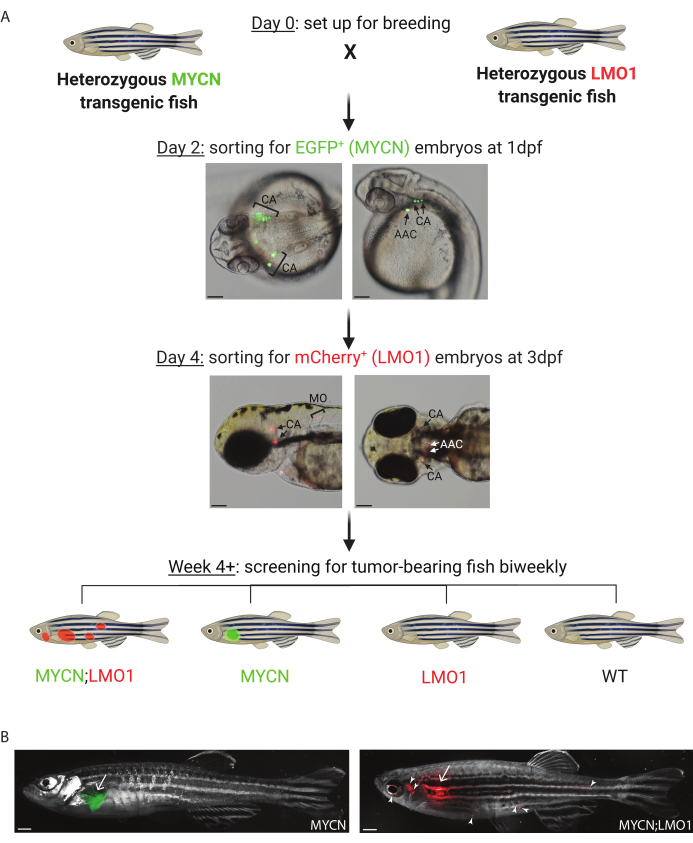
Figure 1: Illustration of the tumor screening assay on offspring from the breeding of MYCN and LMO1 transgenic zebrafish lines. (A) Schematic illustration of sorting and tumor screening of MYCN and/or LMO1-overexpressing stable transgenic fish for neuroblastoma study. Upper panels: Representative pictures of EGFP-MYCN+ embryos at 1 day postfertilization (dpf) (dorsal view on the left and lateral view on the right). Lower panels: Representative pictures of mCherry-LMO1+ embryos at 3 dpf (lateral view on the left and ventral view on the right). AAC, arch-associated catecholaminergic neurons; CA, cranial ganglia; and MO, medulla oblongata. Scale bar, 100 µm. Created with BioRender.com (B) Coexpression of LMO1 and MYCN promotes neuroblastoma metastasis. Left: Transgenic fish overexpressing MYCN alone (MYCN) with EGFP-expressing tumor (white arrow) at 36 months of age. Right: Transgenic fish overexpressing both MYCN and LMO1 (MYCN;LMO1) with a mCherry-positive tumor mass at the primary site (IRG, white arrow) and multiple metastatic sites (solid arrowheads) at 36 months of age. Scale bar, 1 mm. Please click here to view a larger version of this figure.
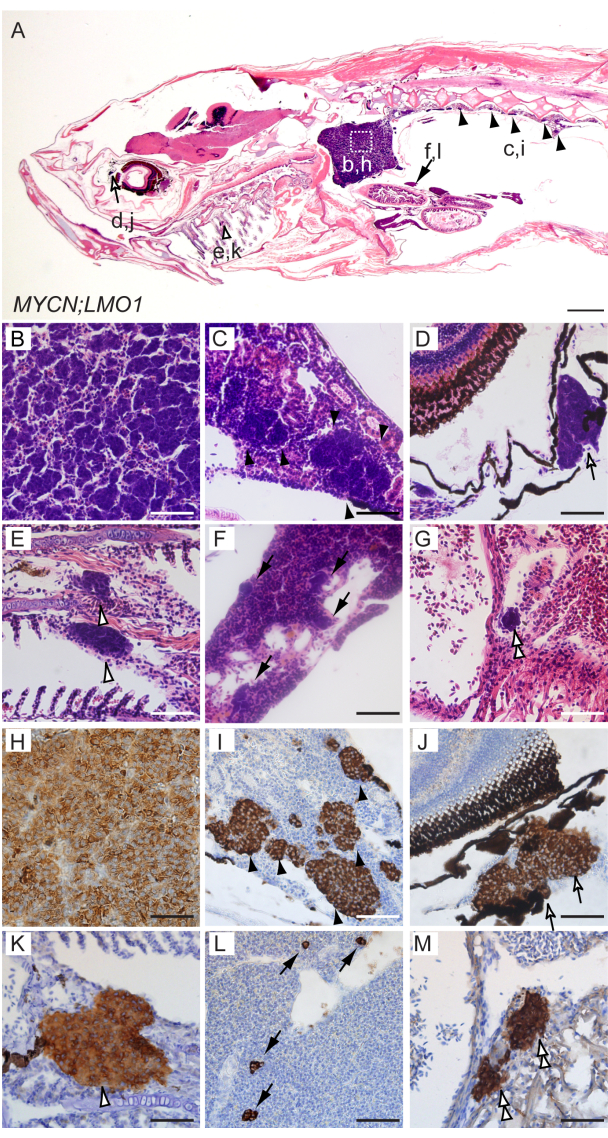
Figure 2: Co-overexpression of MYCN and LMO1 promotes distant metastases of neuroblastoma in transgenic zebrafish model. (A-G) H&E-stained sagittal sections of MYCN;LMO1 transgenic fish while at 6 months of age. (H-M) Magnified views of immunohistochemical analyses of MYCN;LMO1 transgenic fish in sagittal tissue sections, using tyrosine hydroxylase (TH) antibody. White box outlines the interrenal gland (b, h), with magnified views in panels B and H. Disseminated tumor cells were found in kidney marrow (c, i, C, and I with solid black arrowheads), the sclera of the eye (d, j, D, and J with black outlined and white filled open arrows), the gill (e, k, E, and K with black outlined and white filled open arrowheads), the spleen (f, l, F, and L with solid black arrows), and the heart chamber (G and M with black outlined and white filled double arrowheads). Scale bars, 100 µm (A) and 50 µm (B-M). This figure has been modified from Zhu, S. et al. LMO1 Synergizes with MYCN to Promote Neuroblastoma Initiation and Metastasis. Cancer Cell. 32, 310-323 (2017)13. Please click here to view a larger version of this figure.
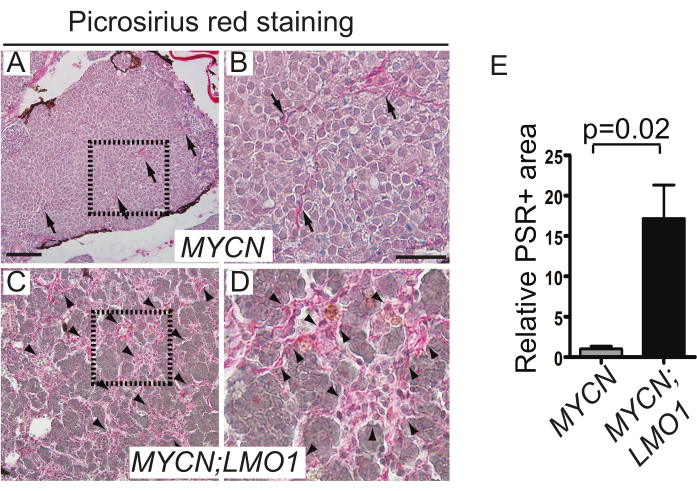
Figure 3: Increased LMO1 expression promotes collagen deposition and ECM stiffness leading to facilitated tumor cell dissemination in zebrafish models. (A-D) Representative light microscopy images of collagen fibers stained by Picrosirius red (PSR) in MYCN only (A,B) or MYCN;LMO1 (C,D) transgenic zebrafish. (B) and (D) are magnified from the boxed areas of (A) and (C), using arrows (A and B) and arrowheads (C and D) to indicate the PSR-positive collagen fibers, respectively. Scale bars, 100 µm (A and C) and 50 µm (B and D). (E) Quantification of PSR-stained areas on tumor sections of MYCN only or MYCN;LMO1 transgenic fish. Results were normalized to the mean of PSR-stained areas in MYCN-only tumors. The statistics present as the mean ± SD of three MYCN-only or three MYCN;LMO1 tumors; p = 0.02 by two-tailed t-test. This figure has been modified from Zhu, S. et al. LMO1 Synergizes with MYCN to Promote Neuroblastoma Initiation and Metastasis. Cancer Cell. 32, 310-323 (2017)13. Please click here to view a larger version of this figure.
Discussion
Zebrafish has been commonly used in research for the past few decades, especially in cancer research, for obvious reasons, such as its ease of maintenance, robust reproduction, and clear advantages for in vivo imaging1,28. The zebrafish model can be easily manipulated embryonically due to their external fertilization and development, which complements well to mammalian model organisms, such as rats and mice, for large-scale genetic studies1,2,3. Moreover, the zebrafish genome has high-level similarities to the human genome. Comparing the detailed annotations of the zebrafish genome to the human reference genome, about 70% of human genes have been shown to obtain a zebrafish orthologue29. In addition, other uses of zebrafish in research have been extended to drug discovery and patient avatars for individualized cancer therapy30,31. Accumulating studies have shown that tumors induced in zebrafish are similar to human tumors at the histological and molecular levels, which can aid in dissection of tumor initiation, progression, and heterogeneity32,33. Together, the zebrafish demonstrates tremendous potential as a valuable animal model that can be used to study metastasis and elucidate possible oncogenic pathways involved in disease pathogenesis.
Using the transgenic zebrafish model with overexpression of both LMO1 and MYCN, the cooperation between these two oncogenes in NB tumorigenesis and metastasis has been clearly demonstrated. With today's availability of powerful live imaging techniques, tumor screens can be easily performed biweekly and metastasis can be traced over time. The widespread metastasis can also be further confirmed by paraffin sectioning and antibody staining. Strikingly, the metastases detected in the MYCN;LMO1 zebrafish correlate well with the common sites of metastasis seen in high-risk NB cases, such as in the bone marrow, lymph nodes, orbit, and lung34,35, further supporting zebrafish as a feasible and beneficial model for metastasis study.
Moreover, due to relatively small body size, the whole zebrafish can be sectioned though completely, which is yet another clear advantage of this model, allowing thorough characterization of the primary tumor along with the metastases in other regions of the body. The picrosirius red staining of tumor sections has clearly highlighted the collagen networks in fish tumors and demonstrates the increased stiffness of extracellular matrix in tumors with LMO1 overexpression. Although this technique is not unique to zebrafish, its application together with the high-throughput compound screening on zebrafish embryos that are genetically modified or transplanted with tumor cells might provide a novel means in screening for effective compounds that could target extracellular matrix remodeling, which is a critical process involved in tumor cell metastasis.
Stable transgenic zebrafish models are very helpful for us to understand the contribution of candidate oncogenes to tumor development in vivo, although it can be challenging and laborious to develop these lines. Creating a stable transgenic line requires a long period of time since multiple generations must be acquired before line propagation. Furthermore, propagating these lines can be tedious, and strategic mating plans may be needed. For example, the productivity of a MYCN transgenic fish is often markedly reduced once the tumor has developed, and homozygous MYCN transgenic fish do not survive well into adulthood. Therefore, to better maintain the MYCN transgenic fish line, it is recommended to outcross the heterozygous non-tumor-bearing MYCN transgenic fish at a younger age with WT or other genetically engineered fish lines, such as the LMO1 transgenic fish line. To overcome the challenges in developing and maintaining stable transgenic fish lines, mosaic transient transgenesis may be an alternative approach to rapidly and effectively assess the contribution of a single gene or combination of genes to the tumor initiation and progression in primarily injected fish. In addition, the mosaic pattern of transgene integration in the primary injected fish may better mimic the disease pathogenesis, especially those induced by somatic events36.
However, like any other animal model used in research to study cancer, the zebrafish also has its disadvantages. For example, antibodies specifically against zebrafish proteins remain largely underdeveloped, although several antibodies against neuroblastoma marker genes-such as tyrosine hydroxylase, synaptophysin, and HuC-are fortunately working well in zebrafish6,13. To combat this issue, many vendors have begun to test their products and predict the potential of their antibodies in cross-reacting with zebrafish proteins. More information about validated antibodies can also been found in the zebrafish information network (ZFIN). With these efforts, more and more antibodies that can specifically detect zebrafish proteins will soon become available to the zebrafish community. Another challenge of using zebrafish as a genetic model to dissect the interplay of complex signaling pathways in NB pathogenesis is its partially duplicated genome. Such genome duplication, which occurred in the natural ancestry of zebrafish37,38, can often lead to more than one variant of zebrafish homologues to humans. This can cause an evolved gain of novel gene functions or unique expression patterns in the animal model39. Therefore, when studying genes with potential roles in tumor suppression, it may be necessary for multiple alleles of the duplicated genes to be knocked out at the same time to demonstrate their tumor suppression function, which can be a potentially time-consuming and a technically-challenging endeavor.
Nevertheless, the transgenic zebrafish model can faithfully recapitulate all stages of tumor metastasis in vivo, and possesses clear advantages for genetic analysis and real-time imaging of tumor dissemination. This model system, therefore, offers a unique tool for us to address many daunting questions in the field, such as what the molecular and cellular events underlying the multistep process of tumor dissemination and metastasis in vivo are, when the NB cells disseminate from primary tumors, and how the tumor microenvironment contributes to NB metastasis. With the robustness of zebrafish for drug screening and testing, the fish model would also provide a valuable means for the evaluation of efficacy of novel agents and inhibitors to prevent or treat metastatic NB.
Disclosures
The authors declare that they have no competing financial interests.
Acknowledgements
This work was supported by a grant R01 CA240323 (S.Z.) from the National Cancer Institute; a grant W81XWH-17-1-0498 (S.Z.) from the United States Department of Defense (DoD); a V Scholar award from the V Foundation for Cancer Research (S.Z.) and a Platform Grant from the Mayo Center for Biomedical Discovery (S.Z.); and supports from the Mayo Clinic Cancer Center and Center for Individualized Medicine (S.Z.).
Materials
| Name | Company | Catalog Number | Comments |
|---|---|---|---|
| 3,3’-Diaminobenzidine (DAB) Vector Kit | Vector | SK-4100 | |
| Acetic Acid | Fisher Scientific / Acros Organic | 64-19-7 | |
| Agarose GP2 | Midwest Scientific | 009012-36-6 | |
| Anti-Tyrosine Hydroxylase (TH) Antibody | Pel-Freez | P40101 | |
| Avidin/Biotin Blocking Kit | Vector | SP-2001 | |
| BOND Intense R Detection | Leica Biosystems | DS9263 | |
| BOND primary antibody diluent | Leica Biosystems Newcastle, Ltd. | AR9352 | |
| BOND-MAX IHC instrument | Leica Biosystems Newcastle, Ltd. | N/A | fully automated IHC staining system |
| CH211-270H11 BAC clone | BACPAC resources center (BRFC) | N/A | |
| Compound microscope equipped with DP71 camera | Olympus | AX70 | |
| Cytoseal XYL (xylene based mounting medium) | Richard-Allan Scientific | 8312-4 | |
| Eosin | Leica | 3801601 | ready-to-use (no preparation needed) |
| Ethanol | Carolina | 86-1263 | |
| Expand Long Template PCR System | Roche Applied Science, IN | 11681834001 | |
| Gateway BP Clonase II enzyme mix | Invitrogen, CA | 11789-020 | |
| Gateway LR Clonase II enzyme mix | Invitrogen, CA | 11791-100 | |
| Goat anti-Rb secondary antibody (Biotinylated) | Dako | E0432 | |
| Hematoxylin Solution, Harris Modified | Sigma Aldrich Chemical Company Inc. / SAFC | HHS-32-1L | |
| HRP Avidin D | Vector | A-2004 | |
| Hydrochloric Acid | Aqua Solutions | 4360-1L | |
| Hydrogen Peroxide, 3% | Fisher Scientific | H324-500 | |
| I-SceI enzyme | New England Biolabs, MA | R0694L | |
| Kanamycin sulfate | Teknova, Inc. | K2150 | |
| Kimberly-Clark Professional Kimtech Science Kimwipes | Fisher Scientific | 34133 | |
| Lithium Carbonate | Sigma Aldrich Chemical Company Inc. / SAFC | 554-13-2 | |
| Microtome for sectioning | Leica Biosystems | RM2255 | |
| One Shot TOP10 Chemically Competent E. coli | Invitrogen | C404006 | |
| p3E-polyA | Dr. Chi-Bin Chien, Univ. of Utah | N/A | a generous gift (Please refer to webpage http://tol2kit.genetics.utah.edu/index.php/Main_Page to obtain material, which is freely distrubted as described.) |
| Parafin wax | Surgipath Paraplast | 39603002 | Parrafin to parafin |
| Paraformaldehyde | Alfa Aesar | A11313 | |
| pDEST vector (modified destination vector containing I-SceI recognition sites) | Dr. C. Grabher, Karlsruhe Institute of Technology, Karlsruhe, Germany | N/A | a generous gift |
| pDONR 221 gateway donor vector | Thermo Fisher Scientific | 12536-017 | |
| pDONRP4-P1R donor vector | Dr. Chi-Bin Chien, Univ. of Utah | N/A | a generous gift |
| Phenol red, 0.5% | Sigma Aldrich | P0290 | |
| Phosphate Buffered Saline (PBS), 10X | BioRad | 1610780 | |
| Picrosirrius red stain kit | Polysciences | 24901-250 | |
| pME-mCherry | Addgene | 26028 | |
| Proteinase K, recombinant, PCR Grade | Roche | 21712520 | |
| QIAprep Spin MiniPrep Kit | Qiagen | 27104 | |
| RDO Rapid Decalcifier | Apex Enginerring | RDO04 | |
| Sodium Azide (NaN3) | Sigma Aldrich | 26628-22-8 | |
| Stereo fluorescence microscope | Leica | MZ10F | |
| Stereoscopic fluorescence microscope equipped with a digital sight DS-U1 camera for imaging | Nikon | SMZ-1500 | |
| Taq DNA Polymerase | New England Biolabs, MA | M0273L | |
| Tissue-Tek VIP® 6 AI Vacuum Infiltration Processor | Sakura | N/A | Model #: VIP-6-A1 |
| Tricaine-S | Western Chemical Incorporated | 20513 | |
| Xylene | Thermo Fisher Scientific | X3P1GAL |
References
- Veldman, M., Lin, S. Zebrafish as a developmental model organism for pediatric research. Pediatric Research. 64, 470-476 (2008).
- Feitsma, H., Cuppen, E. Zebrafish as a cancer model. Molecular Cancer Research. 6 (5), 694(2008).
- Ethcin, J., Kanki, J. P., Look, A. T. Zebrafish as a model for the study of human cancer. Methods in Cell Biology. 105, 309-337 (2010).
- Benjamin, D. C., Hynes, R. O. Intravital imaging of metastasis in adult Zebrafish. BMC Cancer. 17 (1), 660(2017).
- Kim, I. S., et al. Microenvironment-derived factors driving metastatic plasticity in melanoma. Nature Communications. 8, 14343(2017).
- Zhu, S., et al. Activated ALK collaborates with MYCN in neuroblastoma pathogenesis. Cancer Cell. 21 (3), 362-373 (2012).
- Maris, J. M., Hogarty, M. D., Bagatell, R., Cohn, S. L. Neuroblastoma. Lancet. 369 (9579), London, England. 2106-2120 (2007).
- Park, J. R., et al. Children's oncology group's 2013 blueprint for research: neuroblastoma. Pediatric Blood and Cancer. 60 (6), 985-993 (2013).
- Hoehner, J. C., et al. A developmental model of neuroblastoma: differentiating stroma-poor tumors' progress along an extra-adrenal chromaffin lineage. Laboratory Investigation: A Journal of Technical Methods and Pathology. 75 (5), 659-675 (1996).
- Tsubota, S., Kadomatsu, K. Origin and initiation mechanisms of neuroblastoma. Cell and Tissue Research. 372 (2), 211-221 (2018).
- Tolbert, V. P., Matthay, K. K. Neuroblastoma: Clinical and biological approach to risk stratification and treatment. Cell and Tissue Research. 372 (2), 195-209 (2018).
- Maris, J. M. Recent advances in neuroblastoma. New England Journal of Medicine. 362 (23), 2202-2211 (2010).
- Zhu, S., et al. LMO1 Synergizes with MYCN to promote neuroblastoma initiation and metastasis. Cancer Cell. 32, 310-323 (2017).
- Patton, E. E., Zon, L. I. The art and design of genetic screens: zebrafish. Nature Reviews Genetics. 2 (12), 956-966 (2001).
- Lieschke, G. J., Currie, P. D. Animal models of human disease: zebrafish swim into view. Nature Reviews Genetics. 8 (5), 353-367 (2007).
- Tao, T., et al. LIN28B regulates transcription and potentiates MYCN-induced neuroblastoma through binding to ZNF143 at target gene promotors. Proceedings of the National Academy of Sciences of the United States of America. 117 (28), 16516-16526 (2020).
- Ung, C. Y., Guo, F., Zhang, X., Zhu, Z., Zhu, S. Mosaic zebrafish transgenesis for functional genomic analysis of candidate cooperative genes in tumor pathogenesis. Journal of Visualized Experiments. (97), e52567(2015).
- Zhang, X., et al. Critical role for GAB2 in neuroblastoma pathogenesis through the promotion of SHP2/MYCN cooperation. Cell Reports. 18 (12), 2932-2942 (2017).
- Zimmerman, M. W., et al. MYC drives a subset of high-risk pediatric neuroblastomas and is activated through mechanisms including enhancer hijacking and focal enhancer amplification. Cancer Discovery. 8 (3), 320-335 (2018).
- Koach, J., et al. Drugging MYCN oncogenic signaling through the MYCN-PA2G4 binding interface. Cancer Research. 79 (21), 5652-5667 (2019).
- Kimmel, C. B., Ballard, W. W., Kimmel, S. R., Ullmann, B., Schilling, T. F. Stages of embryonic development of the zebrafish. Developmental Dynamics. 203 (3), 253-310 (1995).
- DuBois, S. G., et al. Metastatic sites in stage IV and IVS neuroblastoma correlate with age, tumor biology, and survival. Journal of pediatric hematology/oncology. 21 (3), 181-189 (1999).
- Wattrus, S. J., Zon, L. I. Stem cell safe harbor: The hematopoietic stem cell niche in zebrafish. Blood Advances. 2 (21), 3063-3069 (2018).
- Menke, A. L., Spitsbergen, J. M., Wolterbeek, A. P., Woutersen, R. A. Normal anatomy and histology of the adult zebrafish. Toxicologic Pathology. 39 (5), 759-775 (2011).
- Renshaw, S. A., Trede, N. S. A model 450 million years in the making: Zebrafish and vertebrate immunity. Disease Models and Mechanisms. 5 (1), 38-47 (2012).
- Junqueira, L. C., Cossermelli, W., Brentani, R. Differential staining of collagens type I, II and III by Sirius Red and polarization microscopy. Archivum histologicum Japonicum (Nihon Soshikigaku Kiroku). 41 (3), 267-274 (1978).
- Sweat, F., Puchtler, H., Rosenthal, S. I. Sirius red F3BA as a stain for connective tissue. Archives of Pathology. 78, 69-72 (1964).
- Ignatius, M. S., Hayes, M., Langenau, D. M. In vivo imaging of cancer in zebrafish. Advances in Experimental Medicine and Biology. 916, 219-237 (2016).
- Howe, C. K., et al. The zebrafish reference genome sequence and its relationship to the human genome. Nature. 496 (7446), 498-503 (2013).
- Fazio, M., Ablain, J., Chuan, Y., Langenau, D. M., Zon, L. I. Zebrafish patient avatars in cancer biology and precision cancer therapy. Nature Reviews Cancer. 20 (5), 263-273 (2020).
- Yoganantharjah, P., Gibert, Y. The Use of the zebrafish model to aid in drug discovery and target validation. Current Topics in Medicinal Chemistry. 17 (18), 2041-2055 (2018).
- Ignatius, M. S., et al. In vivo imaging of tumor-propagating cells, regional tumor heterogeneity, and dynamic cell movements in embryonal rhabdomyosarcoma. Cancer Cell. 21 (5), 680-693 (2012).
- Stoletov, K., Montel, V., Lester, R. D., Gonias, S. L., Klemke, R. High-resolution imaging of the dynamic tumor cell vascular interface in transparent zebrafish. Proceedings of the National Academy of Sciences of the United States of America. 104 (44), 17406-17411 (2007).
- Ahmed, S., et al. Neuroblastoma with orbital metastasis: ophthalmic presentation and role of ophthalmologists. Eye. 20 (4), London, England. 466-470 (2006).
- Papaioannou, G., McHugh, K. Neuroblastoma in childhood: review and radiological findings. Cancer Imaging Society. 5 (1), 116-127 (2005).
- Langenau, D. M., et al. Co-injection strategies to modify radiation sensitivity and tumor initiation in transgenic Zebrafish. Oncogene. 27 (30), 4242-4248 (2008).
- Amores, A., et al. Zebrafish hox clusters and vertebrate genome evolution. Science. 282 (5394), New York, N.Y. 1711-1714 (1998).
- Postlethwait, J. H., et al. Vertebrate genome evolution and the zebrafish gene map. Nature Genetics. 18 (4), 345-349 (1998).
- Opazo, J. C., et al. Whole-genome duplication and the functional diversification of teleost fish hemoglobins. Molecular Biology and Evolution. 30 (1), 140-153 (2013).
Reprints and Permissions
