The chronic despair mouse model (CDM) of depression consists of repetitive forced swim sessions and another delayed swim phase as a read-out. It represents a suitable model for induction of a chronic depressive-like state stable for at least 4 weeks, amendable to evaluate subchronic and acute treatment interventions.
Method Article
Animal Models of Depression - Chronic Despair Model (CDM)
In This Article
Summary
Abstract
Major depressive disorder is one of the most prevalent forms of mental illnesses and causes tremendous individual suffering and socioeconomic burden. Despite its importance, current pharmacological treatment is limited, and novel treatment options are urgently needed. One key factor in the search for potential new drugs is evaluating their anti-depressive potency in appropriate animal models. The classical Porsolt forced swim test was used for this purpose for decades to induce and assess a depressive-like state. It consists of two short periods of forced swimming: the first to induce a depressed state and the second on the following day to evaluate the antidepressant effect of the agent given in between the two swim sessions. This model might be suitable as a screening tool for potential antidepressive agents but ignores the delayed onset of action of many antidepressants. The CDM was recently established and represented a modification of the classical test with notable differences. Mice are forced to swim for 5 consecutive days, following the idea that in humans, depression is induced by chronic rather than by acute stress. In a resting period of several days (1-3 weeks), animals develop sustained behavioral despair. The standard read-out method is the measurement of immobility time in an additional delayed swim session, but several alternative methods are proposed to get a broader view of the mood status of the animal. Multiple analysis tools can be used targeting behavioral, molecular, and electrophysiological changes. The depressed phenotype is stable for at least 4 weeks, providing a time window for rapid but also subchronic antidepressant treatment strategies. Furthermore, alterations in the development of a depressive-like state can be addressed using this approach. CDM, therefore, represents a useful tool to better understand depression and to develop novel treatment interventions.
Introduction
Affective disorders, such as major depressive disorder, are among the most frequent and challenging mental illnesses and are associated with high individual suffering1, an increase of suicide risk2, and cause a considerable socioeconomic burden3 for society. Despite its impact, treatment options are limited, and there is an urgent need for the development of novel antidepressive interventions, especially due to the innovation crisis in psychopharmacology over the last decades. In order to understand the pathophysiology of depression and test potential new agents, rational and valid animal models are urgently needed4. For almost half a century, the classical forced swim test (FST), originally described by Porsolt5, was used as induction and read-out for screening of potential novel antidepressants. It consists of a forced swim period for 5-15 min on day 1, subsequent one-time drug application, and evaluation of the portion mice spend immobile in water in another swim period on the following day. The immobility time was considered to represent a missing natural escape behavior and was thought to correlate with the degree of a depression-like state in the mice5.
The classical FST has been heavily criticized, not only in the scientific community6,7,8 but also in public media8. Most controversies around the FST are due to the short induction and treatment periods of only 1 day in the classical paradigm. It was argued that FST represents rather an acute trauma model than a state comparable to human depression. Moreover, the Porsolt test might be suitable as a screening tool for potential antidepressive agents, but it ignores the delayed onset of action of many antidepressants.
The chronic despair model (CDM)9,10,11,12,13,14,15, which is derived from the original FST, represents a more appropriate animal model for depression. In CDM, repeated swim stress over 5 consecutive days avoids acute traumatic effects. By failing to escape from a repeated and ongoing stressful situation, mice are thought to develop a state of helplessness, surrender, and ultimately despair. This paradigm is more comparable to current psychological theories for the development of depression in humans than a single acute trauma, which is commonly experienced at the onset of a posttraumatic stress disorder. The resulting depression-like state in CDM is stable for up to 4 weeks9 and therefore opens the possibility for longer treatment periods, which are better comparable to clinical conditions, where antidepressants usually need 2-4 weeks to show a benefit16.
The evaluation of the depressive-like state should then be multidimensional. The measurement of immobility time, such as in the classical FST, is useful, but should not be used as the only outcome parameter. Various methods, which are described below, should be able to map different dimensions of a depressive state in line with symptoms usually found in depressed humans. Suitable read-out assessments could include escape behavior (immobility time9,10,17), tail suspension test (TST)9, anhedonia (classical sucrose preference test (SPT)18), motivation-oriented behavior (nose-poke sucrose preference test (NPSPT)10), expectation/exploration-behavior (response to ambiguous signal19; Y-maze test9), electrophysiology (measurements of long-term plasticity (long-term potentiation, LTP; long-term depression, LTD)20), molecular assessments (activation patterns of immediate early genes (IEGs); further stress patterns21).
Theoretically, a repeated swim test can be used to induce a depressed state without any assessment of immobility time. However, it is strongly recommended to provide at least a proof-of-concept experimental series with immobility times. Additionally, CDM represents a suitable model to assess the development of a depressive-like state by measuring immobility time during the induction phase. Specific mouse strains or mice treated before swimming can be evaluated with respect to resilience or vulnerability to stress and the induction of behavioral despair.
Protocol
All experiments were performed in agreement with European guidelines (EU 2010/63) and in accordance with the German animal protection law (TierSchG), FELASA (www.felasa.eu/guidelines.php), the national animal welfare body GV-SOLAS (www.gv-solas.de/index.html) guide for the care and use of laboratory animals, and were approved by the animal welfare committee of the University of Freiburg and by the Comite d’Ethique en Matiere d’Experimentation Animale de Strasbourg (CREMEAS, CEEA35), as well as local authorities. Both sexes of C57Bl6N wild-type mice aged 10-14 weeks (70-98 post-natal days, PND) were used for wild-type (WT) indicated experiments. As a stress-resilient line, the transgenic mouse line with enhanced expression of adenosine A1 receptors under the forebrain neuronal CaMKII promoter was used9,15. After the experiments, mice were sacrificed by cervical dislocation.
1. Preparation
- Obtain an animal research license, including thorough experimental planning.
- Arrival: On arrival, raise the animals in the animal facility to perform the CDM. If the animals are bought from an external supplier, allow them at least 2 weeks to adapt to the new environment.
- Housing: To house the animals, ensure that the cages are not occupied with the maximum number of animals to avoid additional stress. Guarantee that housing conditions are in line with international recommendations of mouse housing (for further information, see22) and constantly maintain them at all times.
NOTE: The most important standard housing conditions include individually ventilated cages with 25-120 air changes per hour, 12 h light-dark cycle, temperature as stable as possible (at least constant between 20-24 °C), humidity as stable as possible (at least between 45%-65%), gnawing material and shelter present, no individual housing. - Time point: Perform all experiments at the same time of the day.
NOTE: No direct assessment has been made to verify the influence of the daytime on CDM, but most behavioral tests evaluating depressive-like states show variations depending on the time of the day23,24,25, and it is highly probable that daytime also influences CDM. - Nesting material: Reduce the nesting material to a minimum. Ensure there are no running wheels, etc., present in the cage.
NOTE: Enriched environment prevents the induction of a depressed state. - Group composition: Allow the animals to remain in the same group throughout the whole experiment. Group the female mice together even from different litters; group the male mice together with littermate male animals. Due to upcoming aggressiveness, especially of males, biting and barbering may become a problem, therefore give special emphasis to the group composition. Avoid single housing as deprivation is a major additional stressor.
- Animals: Use different mouse strains, even though specific differences have been observed9,10. A frequently used mouse strain is C57Bl6N. Label mice in order to perform paired statistical analysis (see step 3.2.4).
- Animal sex: Equally use both male and female mice.
- Animal age: Ensure that the animals are at least 10 weeks (70 PND) old. Do not use younger animals due to the exhaustion caused by swimming.
- Equipment: Use a transparent glass cylinder/beaker with a capacity of at least 2 L, a diameter of 24-26 cm, and a minimum height of 30 cm. Further requirements include a thermometer to check the water temperature, paper towels, red light heating lamp/heating mat or comparable source of heating, timer, stopwatch, quiet surroundings. Videotape the swim sessions for offline analysis and documentation. Ensure that the date and the time are continuously visible on the tape/file, together with an identification code number for the individual animal. Store the files for later analysis and further reference. Film from the side of the glass cylinder, not from above, to facilitate analysis.
2. Induction phase
- Before starting
- Visually observe the animals for abnormalities, including signs of biting or barbering. Exclude the whole cage from the experimental series if an animal shows any minimal injuries. Ensure that a veterinarian is available at any time as injuries will worsen during the experiment and will prevent continuation as mice become more aggressive under the influence of stress.
- Obtain the bodyweight for each animal before starting the experiment. Ensure that the weight loss often observed does not exceed 20% of the initial body weight. Exclude animals with a weight loss of over 20% and immediately euthanize them due to the assumed high suffering.
- Fill up a beaker or cylinder with water at room temperature (22-23 °C) to a height of at least 20 cm from the bottom, leaving a minimum of 10 cm between the water surface and the upper border of the vessel.
- Performance
- Gently transfer the animals into the water. During the swim phase, keep the animal under continuous observation to prevent drowning. Observe from a position where the animal cannot see the experimenter (for instance, video observation from a room next door).
- Set a chronometer at the beginning of the experiment. Take the animals out of the water after 10 min by simply grabbing their tails. Gently dry them with a paper towel and put them either under a heating light or on a heating mat.
- Evaluate only one animal at a time. Ensure that animals cannot see each other (for example, separate the housing cage from the experimental set-up by a room-divider).
- Perform the forced swim session for 10 min each day for 5 consecutive days.
- Finishing
- Transfer the animals back to their home cages after five swim sessions and allow them to rest for at least 2 days. Start specific treatment interventions subsequently.
3. Evaluation of an anti-depressive treatment
- Time course
- Assess the acute and subchronic treatments with the CDM. Depending on the scientific question, adapt the resting period between the induction phase and the read-out.
- To evaluate the acute and rapid-acting potency of ketamine, choose a short resting period (a few days) after the induction phase of CDM. Apply the treatment (i.e., intraperitoneal injection), and then perform the evaluation (additional swim session or different evaluation method) shortly afterward.
- To evaluate the effects of a subchronic treatment, increase the treatment period up to 4 weeks (there is no data available for longer treatment periods). For example, give the oral treatment with imipramine to the animals during 4 weeks after the induction phase and evaluate thereafter.
- Start to evaluate the depressed state right after the end of the treatment period, e.g., the following day. Always choose an identical time period for control and experimental conditions.
- Immobility time
- Proof-of-concept
- To use immobility time as a read-out method, evaluate each day of the induction phase and the test day to provide a proof-of-concept (see Figure 1). For further experimental series, reduce the assessments to day 1, day 5, and the test day (see Figure 1C).
- Videotape each experiment. Allow two trained observers who are blinded to the experimental conditions to perform the analysis independently. Video analysis enables the experimenter to observe the behavior from a different room, therefore minimizing the interference with the test (for example, see the video file in the supplementary material).
- Conditions: Observe and identify the three different behavioral conditions during the swim test: struggling, swimming, and immobility. Most researchers focus on immobility; a further differentiation between struggling and swimming is rarely useful and dramatically increases the complexity and duration of the analysis.
- Struggling: The animal actively tries to escape from the threatening situation. This involves pawing the side of the cylinder with the head oriented toward the wall and movements of all limbs. The water surface is typically slightly turbulent.
- Swimming: The animal moves at least both hind paws and travels a distance throughout the water. It actively searches for a way out but does not try to overcome the glass wall of the vessel. Swimming does not involve lifting the paws above the water surface, and the body is usually oriented parallel to the walls of the cylinder. In this condition, animals frequently turn around or move in circles.
- Immobility: The animal keeps still, in a freezing-like position, and does not move at all or only moves the tail, or the forepaws to keep its head above the water surface. No distance is actively traveled except for passive floating, and no directed movement of the front paws is observed.
- Tracking
- Perform the assessment using offline video recordings. Use blinded ratings by two independent and experienced examiners and calculate averages between the two ratings.
- Repeat the ratings if the results of the two raters differ above a previously determined range. Continuously observe the mice as the different conditions frequently change between struggling, swimming, and immobility.
- Use a stopwatch to measure the total time spent in a focused stage (usually immobility) over the 10 min the mouse stays in the water. Consider a short latency of about a second before changing the ongoing time measurement (e.g., if an animal remains for 20 s in immobility and only moves once for less than a second and returns to immobility for another 10 s, the total immobility time is 30 s).
- Statistics: Due to the relatively high inter-individual standard deviation (probably caused by a transfer of hierarchy-depending behavior from the cage to the swim test), mark or label the animals to perform paired (instead of unpaired) parametric tests afterward. Evaluate the normality distribution and, depending on the specific question, perform analysis of variance (ANOVA) with post-hoc t-tests or paired t-tests to compare the different groups. Perform the analysis using absolute values of immobility time (s) or as normalized values.
- Absolute values: Give mean values of the immobility time from day 1 to day 5 and for the test day ± SEM (see Figure 1A). Compare the averaged values for day 1 and day 5, preferably using a paired t-test to validate the induction of a depressed state. If there is a significant difference between day 1 and 5, compare the mean values of day 5 to the averaged results of the test day. Ensure that a typical group size in one experiment is between 6 and 10 animals and expect significant differences between baseline and post-induction immobility times in wild-type animals. Comparing different groups with an unpaired t-test is difficult if absolute values are used because of baseline differences; therefore, use normalized values.
- Relative/Normalized values: Compare the different treatment effects by normalization to the individual result on day 5, and then express the values as a percentage of day 5 (see Figure 1B).
- Control experiments
NOTE: The swimming performance might be correlated with locomotion. Substances that cause a hyper-locomotion could induce false-positive results (namely, a decrease of immobility time); as well as sedative agents could artificially increase immobility time.- Evaluate the changes in locomotion for unknown substances before performing the swim analysis. Use Open Field Test (OFT) in a separate group of animals for at least 10 min.
- Choose the same observation time (10 min) in the OFT as in the CDM to detect unspecific hyper-locomotive effects of the tested compound that might influence CDM read-out via measurement of immobility-time with high validity.
- In case of significant hyper-locomotive effects, do not evaluate the swim session to assess the anti-depressive potency but use different read-out methods (for instance, sucrose preference, tail suspension test, etc.).
- Proof-of-concept
4. Evaluation of the development of a depressive-like state
- To evaluate the development of a depressive disorder, assess each day of the induction phase to measure the immobility-time.
NOTE: In this case, a minor increase of immobility-time between each day describes resilience, whereas a stronger and earlier increase compared to untreated or wild-type animals represents an enhanced vulnerability to stress-induced despair. By treating mice before the swimming event, the preventive intervention or transgenic mouse lines could be assessed concerning the development of behavioral despair.
Results
In the first swim session of the induction phase of CDM, mice usually show a mean immobility time between 190 s and 230 s, which constantly rises with every additional swim session (Figure 1A). This increase is more pronounced in the first 3 days and reaches a plateau-like phase during the last 2-3 days. The immobility-time measured on day 5 remains stable over up to 4 weeks, indicating stable behavioral despair. The antidepressant potency of an intervention can be evaluated by treating the animal between the last day of the induction phase and the test day. Note that the absolute scoring time during the swim sessions is quite subjective and depends on the experimenter, age, sex, and the mouse-line used. However, the relative difference between the sessions is fairly stable with only small interrater differences.
In Figure 1, several representative treatments are shown. Imipramine, sleep deprivation, and ketamine significantly reduced the immobility-time, while sleep deprivation combined with a recovery sleep did not show a significant change of the depressive-like phenotype. These results are concordant with an anti-depressive potency of the applied treatments and similar to effects observed in human patients. The treatment involved ingestion of imipramine 20 mg/kg/day for 3 weeks via drinking water, 3 mg/kg of ketamine by a single intraperitoneal injection 24 h before testing, and sleep deprivation for 6 h before testing.
Depending on the research question, various representations may be displayed. A representation of absolute values can give a real data overview and allows a good evaluation of the induction phase and of a single treatment (Figure 1A,D). However, the differences of various treatments cannot be directly compared; hence each treatment group has different mean values of immobility-time on day 5. Therefore, it is recommended to use the representation of normalized mean values in this case (Figure 1B). A reduced representation may be chosen due to space limitations (Figure 1C). Note that it is mandatory to show at least the results of day 1, day 5, and the test day.
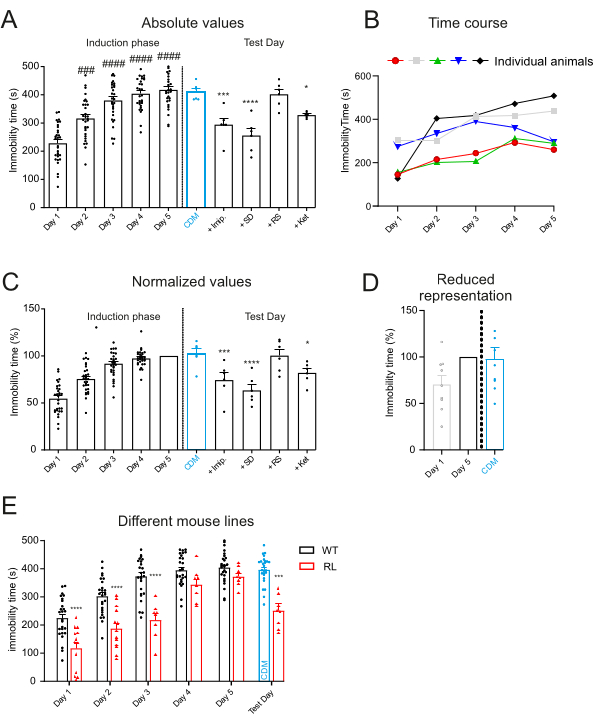
Figure 1: Successful results in absolute and normalized values. (A) Successful induction of a depressed-like state in 30 mice can be observed. Each dot represents the immobility time of a single animal on a specific day and bars represent the mean values of the tested animals. Immobility time is represented for each day of the induction phase (day 1 to day 5) and for the test day (after the dotted line) with or without treatment. Note that in this sample, a significant increase can be observed between day 1 and day 2. In some cases, significance levels are first achieved between day 1 and day 3. For the continuation of the experiment, a statistically significant increase between day 1 and day 5 is mandatory. Note the typical ceiling effect (increase between days 1, 2, and 3, compared to the difference between days 4 and 5). Between day 5 and the test days, animals were housed for 4 weeks in their home cages, either without further treatment (CDM) or treated with imipramine (Imip.); sleep deprivation (SD); sleep deprivation and recovery sleep (RS), and ketamine (Ket). (B) Exemplary time course of the performance of individual animals are given for each day. (C) Normalized representation of the same results already shown in Figure 1A. The immobility time of each animal and day was normalized to its corresponding immobility time on day 5 and expressed in percentage. Post-treatment values of different groups can be better displayed and compared using this approach. (D) Representation of normalized values for day 1, day 5, and the test day (CDM). After a successful proof of concept study, evaluation time points may be reduced to day one, day five and the test day. These time points are needed because a significant increase between day 1 and day 5 is necessary to demonstrate a successful induction, and day 5 needs to be compared to the test day to give a statement on treatment efficacy. (E) Comparison of the immobility time of three different mouse lines: Wildtype (WT) shows a successful induction; an exemplary resilient-line (RL) shows a significantly decreased depression-like behavior on the first three days and on the test day. One-way ANOVA with Bonferroni post hoc test: ∗/#p < 0.05, ∗∗/##p < 0.01, ∗∗∗/###p < 0.001, ∗∗∗∗/####p < 0.0001. (#indicate difference to mean values of day 1, ∗indicate difference to mean values of day 5 in Figure 1A,C and to WT mouse line in Figure 1E). Data are expressed as the means ± SEM. Please click here to view a larger version of this figure.
In case of an unchanged immobility time during all the 5 days (Figure 2), the applied stress was not able to change the behavior relevantly, and no treatment effects can be evaluated; animals need to be sacrificed and must not be used further.
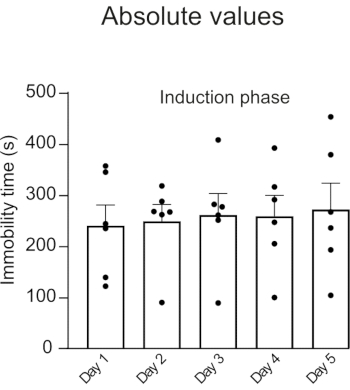
Figure 2: Unsuccessful results. A representation of an ineffective induction is shown in the figure. Note that no significant increase in immobility time between day 1 and day 5 occurs. Therefore, criteria for continuation of the experiment were not achieved, and no further prolongation is rational (in this case, only male mice were tested, and after retrospective investigation, it was found that they were not littermates). Please click here to view a larger version of this figure.
Further read-out methods must be used to describe a broader view of the behavioral despair of the animals. A variety of behavioral tests, electrophysiological measurements, and molecular assessments of stress-induced changes are available. Exemplary results for Tail Suspension Test (TST), with CDM, imipramine and ketamine treatment, Nose-poke-Sucrose Preference Test (NPSPT), and assessment of long-term potentiation using the patch-clamp technique are given in Figure 3. These results encourage using the CDM induction phase as a general tool for the induction of behavioral despair. For further details of the used techniques (TST, NPSPT, LTP-assessment) see9,10,17,20.
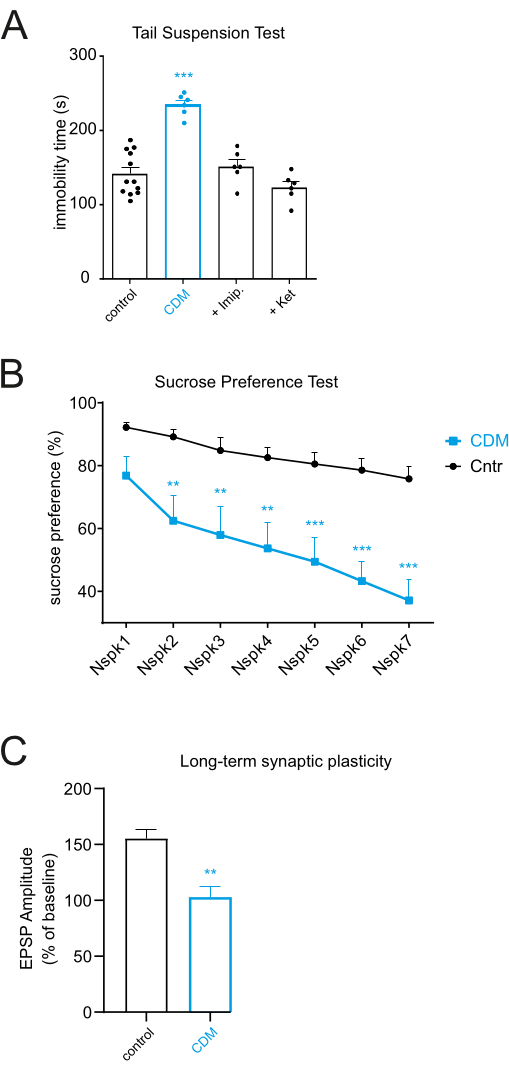
Figure 3: Additional results with CDM mice. (A) An exemplary representation of the effects of CDM in the Tail Suspension Test. Mice were suspended by their tail, and the time spent immobile was recorded (for methodological details see9). Each dot represents the immobility time of a single animal, and bars represent the mean values of the tested animals. One-way ANOVA with Bonferroni post hoc test: ∗∗∗p < 0.001. Data are expressed as the means ± SEM. (B) Representative results of the recently established nose-pokes sucrose preference test in CDM mice. In this task, sucrose preference was measured with gradual increasing effort to reach the sucrose bottle (number of nosepokes) (for methodological details see10). Note that sucrose preference was decreased in CDM and that the difference between CDM and control mice gradually increases with the effort (mean values of nose pokes on each day indicated as Nspk1-7) mice had to apply to drink the sweet solution. Two-way ANOVA with Bonferroni post hoc test: ∗∗p < 0.01, ∗∗∗p < 0.001. Data are expressed as the means ± SEM. (C) CDM-dependent changes in long-term synaptic plasticity are presented as changes of mean values of EPSPs after the application of an associative LTP induction protocol in hippocampal brain slices of WT mice. Data were obtained by stimulation of the CA3-CA1 synapse (for details see17,20). Unpaired t-test, ∗∗p < 0.01, data are expressed as the means ± SEM. Please click here to view a larger version of this figure.
Supplementary Material. Please click here to download this File.
Discussion
The CDM model represents a relevant and established model for testing the anti-depressive potency of new interventions and opens an extended time window for molecular or electrophysiological experiments to elucidate the pathophysiology of depression. Especially when combined with other tests to assess a depression-like state, CDM has a high face and concept validity. It combines subchronic stress and acquired helplessness for induction and produces a long-lasting depressive-like state. It is insensitive to the single application of classical antidepressants but responds to subchronic application and therefore mimics the situation in humans. In a time window of 4 weeks, many different antidepressive interventions show efficacy, ranging from different classes of antidepressants, non-invasive brain stimulation, sleep deprivation to rapid-acting antidepressants9,10,11. Furthermore, the measurement of immobility time during the induction phase could be used as a marker of stress resilience or vulnerability, in case of testing transgenic animals or mice treated before the induction phase. All in all, the CDM is economical in terms of cost, duration, standardization, and reproducibility between labs. Even though the performance seems fairly simple-"you drop a mouse into a water vessel and take it out after 10 min"-there a several critical points that must be kept in mind in order to obtain reasonable and stable results. Most problems are due to insufficient accuracy during preparation or analysis.
A commonly experienced problem is that mice, especially males, do not show a significant increase in immobility time in the induction phase. In these cases, mice might have been already stressed before the induction starts; therefore, additional stress during the swim protocol does not cause a relevant increase of despair. Note that immobility time seems to have a ceiling effect since the increase between day 1 and 2 is larger than between day 2 and 3, respectively. After day 3, usually, no further significant increase can be expected. Common reasons for excessive baseline stress might include recent transportation of the animals or cohabitation of adolescent/adult male animals, a condition that never occurs in nature. Therefore, the experimenter should be cautious and always assure that animals are littermates, that they had enough time to acclimatize to the new surroundings and that there are no signs of biting or barbering before the experiment starts. Furthermore, the animals must be weighed each day and weight loss must be controlled to not exceed 20% of the initial body weight. A greater weight loss is considered critical, due to the fact that repetitive swimming is exhausting and animals that are not capable of maintaining their body weight suffer too much from this exhaustion. A critical point here is that animals suffering too much from exhaustion are probably not able to swim or struggle for 10 min during the test. When immobility times of those animals are analyzed, they tend to show a false negative outcome due to physical exhaustion.
Another problematic circumstance that sometimes occurs, especially when longer treatment periods are required, is a spontaneous decrease of immobility time in the test evaluation. After 4 weeks, immobility time usually decreases compared to assessments performed 2 days after the end of the induction period (N.B. this corresponds, although with a different time scale, to the situation in humans where depressed episodes are usually self-limiting). To minimize this pitfall, it should be guaranteed that no unnecessary nesting material is applied to the animal's home cage, which can be regarded as an effective antidepressive intervention (enriched environment). Furthermore, an increase in group size might help to decrease variance. If necessary, an additional swim session may be added as a modification of the standard protocol described above. For instance, an increase from five to seven swim sessions on 7 consecutive days could be performed and should result in a more stable depressed state of the animals. It is not recommended to further increase the duration of the individual swim session to avoid excessive exhaustion.
There is no agreement within the scientific community about the most sensible time frame to be analyzed. While some groups consider all 10 min important9,10, others argue that the behavior within the first few minutes represent an acute stress situation and analyze only the last 4 min or 6 min18. The latter assumption is mainly derived from the common practice in the evaluation process of the classical FST. Experimental evidence addressing the question of the most rational time frame to be analyzed in CDM is missing. Various high-ranked publications used the analysis of the whole 10 min in CDM9,10.
Despite increasing numbers of commercially available software for automated video analysis, no set-up has demonstrated sufficient accuracy to replace a trained observer. Most software rely on tracking of locomotion of mice in the water and requires a camera position from above. Assessments by skilled humans have the advantage that not only locomotion but also assumed intention of more complex movements can be assessed, including the intensity of paw movements. For instance, mice frequently move by turning around their body or by subtle tail movements to keep their head above the water, which software usually tracks as swimming. Another example is the movement directed toward the glass wall of the vessel, including frequent nose poked from a short distance. Despite the clear intention to escape by vertical movements, the software frequently tracks immobility due to little locomotion. However, accurate and reliable assessments remain difficult and time-consuming. It is recommended to train a rater by an experienced experimenter and prepare joint assessments of sample videos by the two independent raters to discuss common definitions and ambiguities. Moreover, the first results of a laboratory with the CDM should be compared to previously published results from other groups.
Researchers using the CDM might frequently experience the notion that increased immobility is a rather intelligent end energy-saving learned reaction of mice to an inescapable but temporary stressful situation. In our opinion, this overrates the cognitive flexibility of mice; however, it emphasizes the necessity for further assessments of a depressed state independent of immobility time. It can further be argued that other well-established animal models of depression as the Chronic Mild Stress test, produce similar outcomes; and that a depressed state or strong stressors impede, not increase learning both in humans and in animals17,20,26,27,28,29,30.
The burden of the animals is usually rated as high to extreme in animal research applications. Experimental series should be thoroughly planned to minimize the number of animals, and animals should be treated with care and respect before and after the swim sessions. However, in some countries, it might not be possible to obtain an animal research license for the CDM. The CDM allows the assessment of anti-depressive efficacy of a wide range of interventions and the induction of a relatively stable depressed state. The heterogeneity and complexity of major depressive disorder in humans cannot be replicated in any animal model. Most animal models of depression are based on stress-induced/trauma-like experience in mice, which is not necessarily the case in humans, where childhood deprivation, complex learning history and/or sociocultural risk factors also seem to be important. Mouse models of depression should therefore be recognized as what they are: a simplified model for a highly complex disorder. However, if performed adequately and if multiple read-out methods are used, the CDM is a suitable tool in the search for novel insights and targets in depression research.
Disclosures
All the authors declare no conflicts of interest.
Acknowledgements
This work was funded by internal funds of the University Clinic Freiburg, Department of Psychiatry and Psychotherapy and the Berta-Ottenstein Program for Clinician Scientists (to SV). TS is funded by the grants of Medical Research Foundation (FRM) (AJE201912009450) and the University of Strasbourg Institute of Advance Studies (USIAS) (2020-035), as well as Centre National de la Recherche Scientifique (CNRS), France.
Materials
| Name | Company | Catalog Number | Comments |
|---|---|---|---|
| Beaker, 2000 mL | Kimble Kimax | 14000-2000 | any vessel >2000ml and diameter of 24-26 cm possible |
| Digital Thermometer | Hanna Instruments | 846-4708 | any digital thermometer possible |
| Digitalwaage 200 g Dipse | DIPSE | tp200 | any digital scale possible |
| Lenovo ThinkCentre V50a-24IMB AiO 11FJ00DVGE - 60,5 cm | Lenovo | A 908278 | any standard Personalcomputer possible |
| Logitech PTZ Pro | Logitech | 1000005246 | any high resolution camera possible |
| Stopwatch ROTILABO | Carl Roth | L423.1 | any stopwatch possible |
| Timer ROTILABO | Carl Roth | A802.1 | any timer possible |
References
- James, S. L., et al. Global, regional, and national incidence, prevalence, and years lived with disability for 354 diseases and injuries for 195 countries and territories, 1990-2017: a systematic analysis for the Global Burden of Disease Study 2017. The Lancet. 392 (10159), 1789-1858 (2018).
- Aleman, A., Denys, D. Mental health: A road map for suicide research and prevention. Nature. 509 (7501), 421-423 (2014).
- Greenberg, P. E., Fournier, A. -A., Sisitsky, T., Pike, C. T., Kessler, R. C. The economic burden of adults with major depressive disorder in the United States (2005 and 2010). The Journal of Clinical Psychiatry. 76 (2), 155-162 (2015).
- Nestler, E. J., Hyman, S. E. Animal Models of Neuropsychiatric Disorders. Nature Neuroscience. 13 (10), 1161-1169 (2010).
- Porsolt, R. D., Le Pichon, M., Jalfre, M. Depression: a new animal model sensitive to antidepressant treatments. Nature. 266 (5604), 730-732 (1977).
- Can, A., et al. The mouse forced swim test. Journal of Visualized Experiments: JoVE. (59), e3638(2012).
- Chatterjee, M., Jaiswal, M., Palit, G. Comparative evaluation of forced swim test and tail suspension test as models of negative symptom of schizophrenia in rodents. ISRN Psychiatry. 2012, 595141(2012).
- Reardon, S. Depression researchers rethink popular mouse swim tests. Nature. 571 (7766), 456-457 (2019).
- Serchov, T., et al. Increased signaling via adenosine A1 receptors, sleep deprivation, imipramine, and ketamine inhibit depressive-like behavior via induction of Homer1a. Neuron. 87 (3), 549-562 (2015).
- Holz, A., et al. Enhanced mGlu5 signaling in excitatory neurons promotes rapid antidepressant effects via AMPA receptor activation. Neuron. 104 (2), 338-352 (2019).
- Sun, P., et al. Increase in cortical pyramidal cell excitability accompanies depression-like behavior in mice: A transcranial magnetic stimulation study. Journal of Neuroscience. 31 (45), 16464-16472 (2011).
- Hellwig, S., et al. Altered microglia morphology and higher resilience to stress-induced depression-like behavior in CX3CR1-deficient mice. Brain, Behavior, and Immunity. 55, 126-137 (2016).
- Serchov, T., Heumann, R., van Calker, D., Biber, K. Signaling pathways regulating Homer1a expression: implications for antidepressant therapy. Biological Chemistry. 397 (3), 207-214 (2016).
- van Calker, D., Serchov, T., Normann, C., Biber, K. Recent insights into antidepressant therapy: Distinct pathways and potential common mechanisms in the treatment of depressive syndromes. Neuroscience and Biobehavioral Reviews. 88, 63-72 (2018).
- Serchov, T., et al. Enhanced adenosine A1 receptor and Homer1a expression in hippocampus modulates the resilience to stress-induced depression-like behavior. Neuropharmacology. 162, 107834(2020).
- Quitkin, F. M., Rabkin, J. G., Ross, D., Stewart, J. W. Identification of true drug response to antidepressants. Use of pattern analysis. Archives of General Psychiatry. 41 (8), 782-786 (1984).
- Normann, C., et al. Antidepressants rescue stress-induced disruption of synaptic plasticity via serotonin transporter-independent inhibition of L-type calcium channels. Biological Psychiatry. 84 (1), 55-64 (2018).
- Zanos, P., et al. NMDAR inhibition-independent antidepressant actions of ketamine metabolites. Nature. 533 (7604), 481-486 (2016).
- Alboni, S., et al. Fluoxetine effects on molecular, cellular, and behavioral endophenotypes of depression are driven by the living environment. Molecular Psychiatry. 22 (4), 552-561 (2017).
- Niehusmann, P., et al. Coincidence detection and stress modulation of spike time-dependent long-term depression in the hippocampus. The Journal of Neuroscience: The Official Journal of the Society for Neuroscience. 30 (18), 6225-6235 (2010).
- Schreiber, S. S., Tocco, G., Shors, T. J., Thompson, R. F. Activation of immediate early genes after acute stress. Neuroreport. 2 (1), 17-20 (1991).
- National centre for the replacement refinement and reduction of animals in research. , Available from: https://www.nc3rs.org.uk (2021).
- Loss, C. M., et al. Influence of environmental enrichment vs. time-of-day on behavioral repertoire of male albino Swiss mice. Neurobiology of Learning and Memory. 125, 63-72 (2015).
- Walker, W. H., Walton, J. C., DeVries, A. C., Nelson, R. J. Circadian rhythm disruption and mental health. Translational Psychiatry. 10 (1), 1-13 (2020).
- Merrow, M., Spoelstra, K., Roenneberg, T. The circadian cycle: daily rhythms from behaviour to genes. EMBO Reports. 6 (10), 930-935 (2005).
- Holderbach, R., Clark, K., Moreau, J. -L., Bischofberger, J., Normann, C. Enhanced long-term synaptic depression in an animal model of depression. Biological Psychiatry. 62 (1), 92-100 (2007).
- Nissen, C., et al. Learning as a model for neural plasticity in major depression. Biological Psychiatry. 68 (6), 544-552 (2010).
- Kuhn, M., et al. State-dependent partial occlusion of cortical LTP-like plasticity in major depression. Neuropsychopharmacology. 41 (6), 1521-1529 (2016).
- Schwabe, L. Stress and the engagement of multiple memory systems: integration of animal and human studies. Hippocampus. 23 (11), 1035-1043 (2013).
- Ballan, R., Gabay, Y. Does acute stress impact declarative and procedural learning. Frontiers in Psychology. 11, 342(2020).
Reprints and Permissions
