We designed and constructed a mobile laboratory to measure respiration rates in isolated mitochondria of wild animals captured at field locations. Here, we describe the design and outfitting of a mobile mitochondrial laboratory and the associated laboratory protocols.
Method Article
Development of a Mobile Mitochondrial Physiology Laboratory for Measuring Mitochondrial Energetics in the Field
In This Article
Summary
Abstract
Mitochondrial energetics is a central theme in animal biochemistry and physiology, with researchers using mitochondrial respiration as a metric to investigate metabolic capability. To obtain the measures of mitochondrial respiration, fresh biological samples must be used, and the entire laboratory procedure must be completed within approximately 2 h. Furthermore, multiple pieces of specialized equipment are required to perform these laboratory assays. This creates a challenge for measuring mitochondrial respiration in the tissues of wild animals living far from physiology laboratories as live tissue cannot be preserved for very long after collection in the field. Moreover, transporting live animals over long distances induces stress, which can alter mitochondrial energetics.
This manuscript introduces the Auburn University (AU) MitoMobile, a mobile mitochondrial physiology laboratory that can be taken into the field and used on-site to measure mitochondrial metabolism in tissues collected from wild animals. The basic features of the mobile laboratory and the step-by-step methods for measuring isolated mitochondrial respiration rates are presented. Additionally, the data presented validate the success of outfitting the mobile mitochondrial physiology laboratory and making mitochondrial respiration measurements. The novelty of the mobile laboratory lies in the ability to drive to the field and perform mitochondrial measurements on the tissues of animals captured on site.
Introduction
To date, studies designed to measure mitochondrial energetics have been limited to laboratory animals or animals captured near established physiology laboratories, which precluded scientists from performing mitochondrial bioenergetic studies in tissues collected from animals during such activities as migration, diving, and hibernation1,2,3,4,5,6. While many investigators have successfully measured the basal and peak metabolic rates and daily energy expenditures of wild animals7,8, the capacity of researchers to measure the performance of mitochondria has remained limited (but see1,4,9). This is partly due to the need for fresh tissue for isolating mitochondria and a laboratory facility to perform the isolations within about 2 h of obtaining the fresh tissue. Once the mitochondria have been isolated, the mitochondrial respiration measurements should also be completed within ~1 h.
Isolated mitochondrial respiration rates are usually performed by measuring oxygen concentration in a sealed container connected to a Clark electrode. The theory behind this method is founded on the basic observation that oxygen is the last electron acceptor of mitochondrial respiration during oxidative phosphorylation. Therefore, as oxygen concentration falls during an experiment, it is assumed that adenosine triphosphate (ATP) production occurs10. Consumed oxygen is a proxy for produced ATP. Researchers can create specific experimental conditions using different substrates and initiate adenosine diphosphate (ADP)-stimulated respiration (state 3) by adding predetermined amounts of ADP to the chamber. Following the phosphorylation of the exogenous ADP to ATP, the oxygen consumption rate decreases, and state 4 is reached and can be measured. Furthermore, the addition of specific inhibitors allows information regarding leak respiration and uncoupled respiration to be obtained10. The ratio of state 3 to state 4 determines the respiratory control ratio (RCR), which is the indicator of overall mitochondrial coupling10,11. Lower values of RCR indicate overall mitochondrial dysfunction, whereas higher RCR values suggest a greater extent of mitochondrial coupling10.
As previously stated, the collection of biological material, mitochondrial isolation, and measurement of respiration rates must be completed within 2 h of obtaining tissue. To accomplish this task without transporting animals over large distances to established laboratories, a mobile mitochondrial physiology laboratory was constructed to be taken to field locations where these data can be collected. A 2018 Jayco Redhawk recreational vehicle was converted into a mobile molecular physiology laboratory and named the Auburn University (AU) MitoMobile (Figure 1A). A recreational vehicle was selected because of the built-in refrigerator, freezer, water storage tank and plumbing, electricity powered by 12-volt batteries, gas generator, propane tank, and self-leveling system. Further, the recreational vehicle provides the capability of staying at remote sites overnight for data collection. The front of the vehicle was not altered and provides the driving and sleeping quarters (Figure 1B). Previously installed bedroom amenities (bed, TV, and cabinet) in the rear of the vehicle and the stovetop were removed.
Custom-made stainless-steel shelving and a custom quartz countertop supported by 80/20 aluminum framing were installed in place of the bedroom amenities and stovetop (Figure 1C). The laboratory benches provide adequate space for data collection (Figure 1D). Power consumption of each piece of equipment (i.e., refrigerated centrifuge, mitochondrial respiration chambers, plate readers, computers, homogenizers, scales, portable ultra-freezer, and other general laboratory supplies) was taken into consideration. To support the large voltage and current demands of the centrifuge, the electrical system was upgraded to that of aircraft-grade equipment. An external compartment in the rear of the vehicle was converted into a liquid nitrogen storage bay, which meets the United States Department of Transportation's guidelines for liquid nitrogen storage and transport. This storage unit was constructed with stainless steel and has proper venting to keep any expanding nitrogen gas from leaking into the passenger compartment of the vehicle.
To confirm that the mobile laboratory can be used in mitochondrial bioenergetic studies, mitochondria were isolated, and mitochondrial respiration rates from wild-derived house mice (Mus musculus) hindlimb skeletal muscle were measured. Because Mus musculus is a model organism, the mitochondrial respiration rates of this species are well-established12,13,14. Although previous studies have documented mitochondrial isolation via differential centrifugation15,16,17, a brief overview of the methods used in the mobile mitochondrial physiology laboratory methods is described below.
Protocol
The following sections describe the mitochondrial laboratory methods. All animal handling and tissue collection procedures were approved by the Auburn University Institutional Animal Care and Use Committee (#2019-3582).
1. Description of buffers used for data collection
NOTE: These buffers can be prepared in a stationary laboratory and moved to the mobile laboratory prior to the field trip (unless otherwise noted below).
- Prepare the skeletal muscle mitochondrial isolation buffer with bovine serum albumin (BSA), as seen in Table 1.
- Dissolve chemicals in deionized water (~ 90% volume) except for the fatty acid-free BSA. Place the buffer in the refrigerator until the temperature is 4 °C.
- Adjust the solution to a pH of 7.5 while maintaining the temperature at 4 °C.
- Add the fatty acid-free BSA and bring up the volume to 100%. Aliquot the solution into 50 mL conical tubes. Store this solution at -20 °C until use.
- Prepare the skeletal muscle mitochondrial isolation buffer without BSA as seen in Table 1.
- Dissolve the chemicals in deionized water (~ 90% volume). Place the buffer in the refrigerator until the temperature is 4 °C.
- Adjust the solution to a pH of 7.5 while maintaining the temperature at 4 °C.
- Bring up the volume to 100%. Aliquot the solution into 50 mL conical tubes. Store this solution at -20 °C until use.
- Prepare the skeletal muscle resuspension buffer as seen in Table 1.
- Dissolve the chemicals in deionized water (~ 90% volume). Place the buffer in the refrigerator until the temperature is 4 °C.
- Adjust the solution to a pH of 7.4 while maintaining the temperature at 4 °C.
- Bring up the volume to 100%. Aliquot the solution into 50 mL conical tubes. Store this solution at -20 °C until use.
- Prepare the skeletal muscle respiration buffer as seen in Table 2.
- Dissolve the chemicals in deionized water (~ 90% volume) except for the fatty acid-free BSA. Heat the buffer until the temperature is 37 °C.
- Adjust the solution to a pH of 7.0 while maintaining the temperature at 37 °C.
- Add the fatty acid-free BSA and bring up the volume to 100%. Aliquot the solution into 50 mL conical tubes. Store this solution at -20 °C until use.
- Prepare the respiration substrates as seen in Table 2.
- Ensure that these substrates are made fresh on the day of data collection in 100 mM Tris-HCl, pH 7.4. Store on ice until use.
NOTE: The provided values are to make a sufficiently concentrated solution for enough substrate to be taken up by the mitochondria. The final concentrations of the substrates are 2 mM pyruvate, 2 mM malate, 10 mM glutamate, and 5 mM succinate.
- Ensure that these substrates are made fresh on the day of data collection in 100 mM Tris-HCl, pH 7.4. Store on ice until use.
2. Performing mitochondrial isolation (Figure 2)
NOTE: Mitochondrial isolation and mitochondrial respiration measurements are performed in the laboratory bench area of the mobile laboratory, and all solutions should be kept at 4 °C unless otherwise noted.
- Park the mobile laboratory on flat ground. Turn on the generator and level the vehicle. Extend the slide and set up the equipment.
- Thaw the desired amounts of buffers.
NOTE: Generally, 30 mL of skeletal muscle isolation buffer and 10 mL of skeletal muscle isolation buffer without BSA are needed per muscle. - Set up and calibrate the mitochondrial respiration chambers to the desired temperature of experiments and current barometric pressure per manufacturer's instructions. See the Table of Materials for specific chambers used in experiments.
- Euthanize the animal via decapitation.
NOTE: The current study used decapitation for euthanasia. Some gases, such as carbon dioxide and isoflurane, affect mitochondrial function18,19,20; these effects should be considered when selecting the best method of euthanasia for each study. Which method should be performed for each study will be determined by the scientific question being asked. - Excise skeletal muscle, quickly trim away fat and connective tissue, weigh, and place the muscle in skeletal muscle isolation buffer with BSA (at least 1/10 w/v) (e.g., 1 g of skeletal muscle to 10 mL of buffer).
- Mince the skeletal muscle with scissors on ice.
- Transfer the minced tissue to a 50 mL centrifuge tube using a cut 5 mL pipet tip. Homogenize it with a blade (see the Table of Materials) at 50% power for 5 s. Add protease (5 mg/g wet muscle) and digest for 7 min, mixing the solution every 30 s. Terminate the reaction by adding an equal volume of isolation buffer with BSA.
- Centrifuge the homogenate at 500 × g for 10 min. Transfer the supernatant through double-layered cheesecloth using a cut 5 mL pipet tip into a clean 50 mL centrifuge tube. Centrifuge the supernatant at 3,500 × g for 10 min to precipitate a brown mitochondrial pellet.
- Pour out the remaining supernatant. Add the same volume of isolation buffer with BSA to the centrifuge tube. Resuspend the mitochondrial pellet with a flexible scraper (policeman) by gently working the mitochondrial pellet off the walls of the centrifuge tube. Centrifuge at 3,500 × g for 10 min.
- Pour out the remaining supernatant. Add the same volume of isolation buffer without BSA to the centrifuge tube. Resuspend the mitochondrial pellet by gently working the mitochondrial pellet off the walls of the centrifuge tube with a clean policeman. Centrifuge at 3,500 × g for 10 min.
- Decant the supernatant and resuspend the mitochondrial pellet in resuspension buffer by gently working the mitochondrial pellet off the walls of the centrifuge tube with a clean policeman.
NOTE: The volume of the resuspension buffer will depend on the size of the mitochondria pellet. - Transfer the resuspended mitochondria to a Dounce homogenizer with a cut 1 mL pipet tip. Using the Dounce homogenizer, carefully homogenize the suspension with 4-5 passes.
- Place the mitochondrial suspension in a labeled 2 mL microcentrifuge tube using another cut 1 mL pipet tip.
3. Mitochondrial respiration measurements (Figure 3)
- Complex I substrates
- Add 945 µL of respiration buffer to the chamber. Ensure that the stirrer is spinning, and the buffer temperature is maintained at 37 °C. Start the recording of the data collection.
- After the oxygen concentration has stabilized, add 20 µL of the mitochondria and place the lid on the chamber. In the software, denote that mitochondria were added to the chamber.
- Add 10 µL of 1 M glutamate, 10 µL of 200 mM malate, and 10 µL of 200 mM pyruvate to the chamber with individual syringes and wait until the signal stabilizes. In the software, denote that substrates have been added.
NOTE: These substrates are typically used to measure carbohydrate-driven respiration. For other combinations of substrates to be used to measure fat-driven respiration, see21. - Add 5 µL of ADP with a separate syringe and observe the rapid oxygen consumption (state 3). In the software, denote that ADP was added.
NOTE: Following the phosphorylation of the added ADP, the oxygen consumption rate will plateau to state 4. - After 4 min of state 4 data collection, terminate the recording. Save the data file.
- Complex II substrates
- Add 963 µL of the respiration buffer to the chamber. Ensure that the stirrer is spinning, and the buffer temperature is maintained at 37 °C. Start the recording of the data collection.
- After the oxygen concentration has stabilized, add 20 µL of mitochondria and place the lid on the chamber. In the software, denote that mitochondria were added to the solution.
- Add 2 µL of 4 µg/µL rotenone followed by 10 µL of 500 mM succinate to the chamber using separate syringes and wait until the signal stabilizes. In the software, denote that substrates have been added.
- Add 5 µL of ADP using a separate syringe and observe the rapid oxygen consumption (state 3). In the software, denote that ADP was added.
NOTE: Following the phosphorylation of the added ADP, the oxygen consumption rate will plateau to state 4. - After 4 min of state 4 data collection, terminate the recording. Save the data file.
Results
The current manuscript investigated the mitochondrial respiration of wild-derived Mus musculus (n = 7, male = 5, female = 2; age = 1.30 ± 0.2 years) in a mobile mitochondrial physiology laboratory (Figure 1). To measure skeletal muscle mitochondrial respiration, the entire hindlimb, thus aerobic and anaerobic muscle, was used for mitochondrial isolation (Figure 2). Examples of raw mitochondrial respiration data are shown in Figure 3. Figure 3A and Figure 3B represent complex I-driven mitochondrial respiration. The steep slope observed in Figure 3A represents the high maximal respiration rate. This is the value used for further data analysis. The successful isolation of mitochondria from the hindlimb skeletal muscle is observed by the sharp turn and the stabilization of a new slope, which determines state 4 (Figure 3B).
These data can also be interpreted as the mitochondria being high functioning due to the sharp turn to establish state 4. A similar pattern can be observed for complex II-driven mitochondrial respiration (Figure 3C and Figure 3D). Figure 3E,F demonstrate poor functioning mitochondria, either due to mitochondrial physiology or unsuccessful mitochondrial respiration. Figure 3E shows the coupling of the mitochondria for complex I-driven mitochondrial respiration, as seen by the turn to state 4. However, Figure 3F demonstrates uncoupled complex II mitochondrial respiration, as demonstrated by a flat line after the addition of ADP, and no "turn" to produce state 4 data. These data would suggest possible problems during mitochondrial isolation, which are discussed below.
The numerical values of state 3, state 4, and RCR for both complex I and complex II of these animals can be found in Figure 4. These data were determined by measuring 30 s of the steepest slope after the addition of ADP to determine state 3 (Figure 3A,C) and measuring the slope after the "turn" for 1 min to measure state 4 (Figure 3B,D). Once these values were obtained, the data were normalized to protein content (via Bradford assay22). Using the normalized values, the RCR was calculated by dividing the normalized state 3 value by the normalized state 4 value.
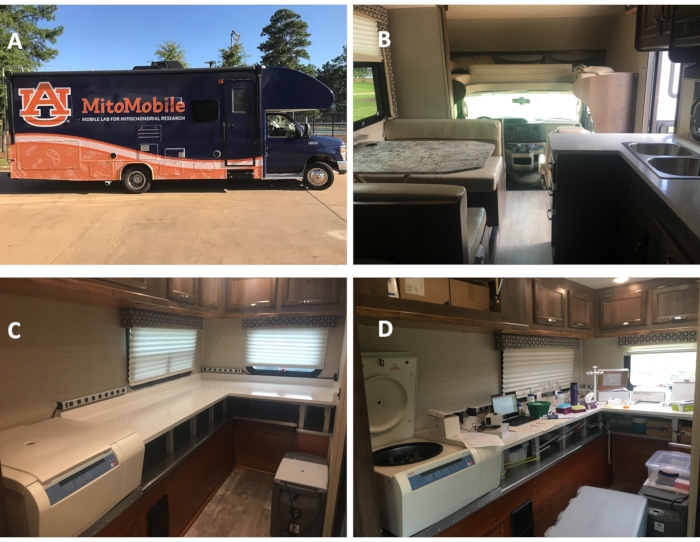
Figure 1: The AU MitoMobile, a mobile mitochondrial physiology laboratory. (A) The outside of the AU MitoMobile. (B) The inside of the vehicle looking at the front where no changes were made. (C) The rear of the vehicle showing the installment of the benches, storage compartments, and centrifuge. (D) The setup of the equipment during data collection. Please click here to view a larger version of this figure.
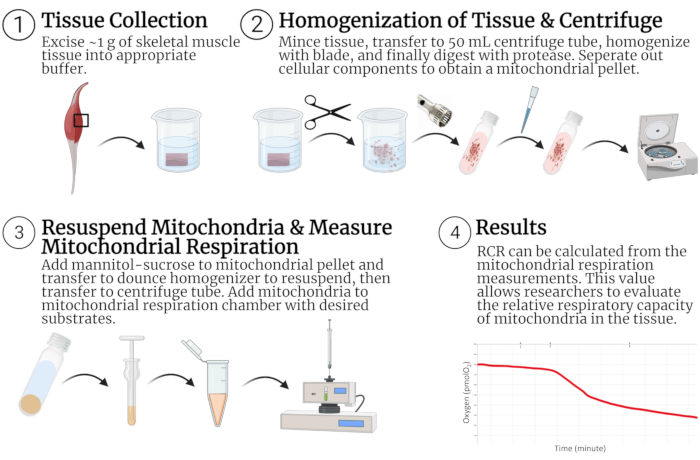
Figure 2: Mitochondrial isolation and respiration measurement procedure in skeletal muscle. (1) Tissue is dissected from the animal and placed in buffer where it is (2) minced, homogenized, treated with protease, and subjected to centrifugation until the mitochondrial pellet is obtained. (3) The mitochondria pellet is resuspended, and respiration data are obtained. (4) Oxygen consumption data can be used to calculate state 3, state 4, and RCR. Abbreviation: RCR = respiratory control ratio. Created with BioRender.com. Please click here to view a larger version of this figure.
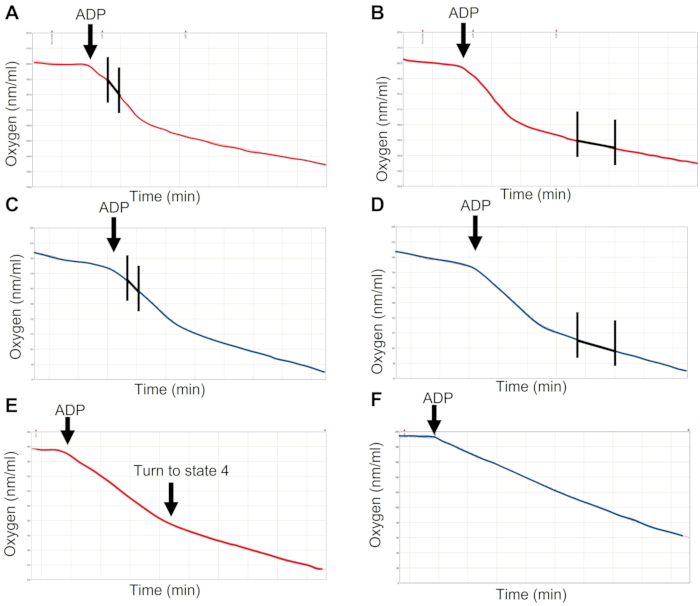
Figure 3: Mitochondrial respiration measurements with complex I and complex II substrates. Oxygen consumption with complex I substrates, highlighting the slope analysis of state 3 (A) and state 4 (B). Oxygen consumption with complex II substrates, highlighting the slope analysis of state 3 (C) and state 4 (D). Suboptimal mitochondrial respiration can be seen in complex I-driven respiration (E) and complex II-driven respiration (F). Please click here to view a larger version of this figure.
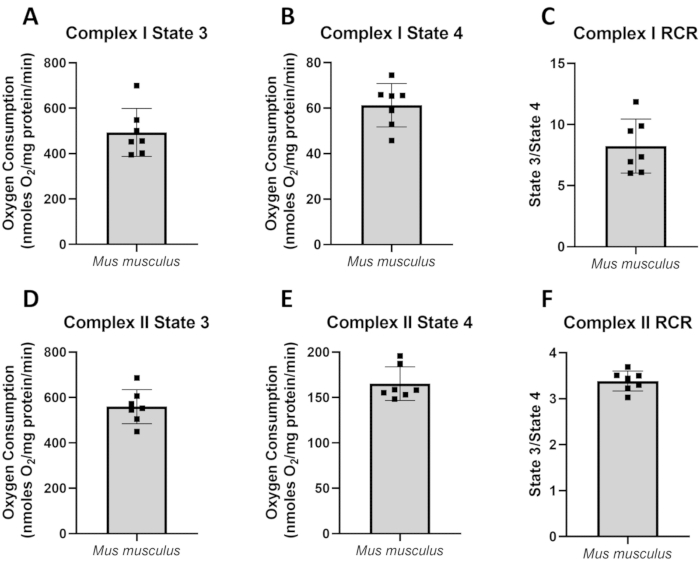
Figure 4: Data collected on house mice (Mus musculus) in the AU MitoMobile. Mitochondrial isolation and respiration were performed using the procedure described here. Pyruvate, malate, and glutamate were used to determine complex I respiration rates. Succinate and rotenone were used to measure complex II respiration rates. (A) Complex I state 3 measurements, (B) complex I state 4 measurements, (C) complex I RCR, (D) complex II state 3 measurements, (E) complex II state 4 measurements, and (F) complex II RCR. Abbreviation: RCR = respiratory control ratio. Please click here to view a larger version of this figure.
| Mitochondria isolation buffer for skeletal muscle | ||
| Reagent | with BSA, concentration (mM) | without BSA, concentration (mM) |
| KCl | 100 | 100 |
| Tris-HCl | 40 | 40 |
| Tris-Base | 10 | 10 |
| MgCl2 | 1 | 1 |
| EGTA | 1 | 1 |
| ATP | 0.2 | 0.2 |
| Fatty acid-free BSA | 0.15% | - |
| Isolated mitochondria resuspension buffer for skeletal muscle | ||
| Reagent | Concentration (mM) | |
| Mannitol | 220 | |
| Sucrose | 70 | |
| Tris-HCl | 10 | |
| EGTA | 1 | |
Table 1: Mitochondria isolation buffers (with and without BSA) and isolated mitochondria resuspension buffer for skeletal muscle.
| Respiration buffer | |
| Reagent | Concentration (mM) |
| KCl | 100 |
| MOPS | 50 |
| KH2PO4 | 10 |
| Glucose | 20 |
| MgCl2 | 10 |
| EGTA | 1 |
| Fatty acid-free BSA | 0.20% |
| Respiration substrates | |
| Reagent | Concentration (mM) |
| Pyruvate | 200 |
| Malate | 200 |
| Succinate | 500 |
| ADP | 100 |
| Glutamate | 1000 |
Table 2: Respiration buffer and substrates.
| State 3 | State 4 | RCR | Study | Substrates |
| 368.3±80.4 | 68.9±25.0 | 5.8±1.6 | 12 | 2 mM pyruvate, 2 mM malate |
| 241.8±22.5 | 28.9±3.2 | 8.3±1.9 | 23 | 5 mM pyruvate, 2 mM malate |
| 285.7±36.5 | 81.9±2.9 | 3.5±1.0 | 23 | 10 mM succinate, 4 µM rotenone |
| 493.4±105.4 | 61.3±9.6 | 8.2±2.2 | Current Study | 2mM pyruvate, 2mM malate, 10 mM glutamate |
| 559.5±74.9 | 165.2±18.5 | 3.4±0.2 | Current Study | 5 mM succinate, 4 µg/µL rotenone |
Table 3: Comparative values of state 3, state 4, and RCR. Abbreviation: RCR = respiratory control ratio. State 3 and state 4 values shown in nmoles O2/mg protein/min.
Discussion
The mobile mitochondrial physiology laboratory enables researchers to isolate mitochondria and measure mitochondrial respiration rates within 2 h of tissue collection at remote field sites. The results presented herein suggest that measurements of mitochondrial respiration made in the AU MitoMobile are comparable to measurements made in a university research laboratory. Specifically, the values for state 3, state 4, and RCR for wild-derived Mus musculus presented here are comparable with previously published results from the same laboratory and others (Table 3)12,23. However, it should be noted that due to different mice strains and methods used, a direct comparison of these studies cannot be made. These results demonstrate proof of concept for the measurement of mitochondrial respiration in this mobile mitochondrial physiology laboratory.
All the chemicals and materials needed for mitochondria isolation and respiration can be transported and stored within the mobile laboratory, allowing ease of access when setting up and performing experiments. Additionally, isolated mitochondria collected in a mobile mitochondrial laboratory provide a unique sample to perform other biochemical measurements such as reactive oxygen species emission. Importantly, frozen mitochondria can be transported to a stationary laboratory for additional biochemical measurements (e.g., individual electron transport chain enzyme activities). Notably, isolating mitochondria via centrifugation differentiation is not the only method to measure mitochondrial respiration. Other laboratories have performed successful measurements of mitochondrial respiration with permeabilized fibers. Although the current manuscript does not describe this method (for more details of permeabilized fibers, see24,25,26,27,28), it is important for readers to note that a mobile mitochondrial physiology lab could also house the materials needed for this procedure. Please see other reviews on the strengths and weaknesses of each of these methods25,29,30.
Several laboratories performing mitochondrial bioenergetics research have published troubleshooting recommendations that readers may find helpful15,17. For any single experimental project, a single batch of buffers should be made to collect all data. Using buffers made on different days creates the opportunity for variation in solutions to impact mitochondrial respiration measurements. Damage to the outer mitochondrial membrane will occur during the isolation process; however, proper execution of the isolation method through laboratory training can minimize the damage that will naturally occur with this procedure29,31. During the isolation process, nonfunctional or overly damaged mitochondria are indicated by a white fluffy mitochondrial pellet rather than a compact brown pellet. Nonfunctional or damaged mitochondria can be caused by an excessive rpm during blade homogenization, homogenizing for too long, adding too much protease or digesting for too long, or too many strokes used during the final resuspension of mitochondria.
Moreover, the choice of what muscle to isolate and how much muscle is used will affect the mitochondrial yield. For example, in an animal with a higher mitochondrial density, such as a bird21, more mitochondria will be precipitated compared to a mix of skeletal muscle fiber types from a hindlimb of a rat. This will also change the amount of tissue needed for successful isolation. The greater the mitochondrial density in a tissue, the lower the amount of tissue needed for successful isolation. Researchers should also consider the volume of mannitol-sucrose solution added to the final isolated mitochondria. A more densely packed mitochondrial pellet will need a higher dilution, while a less densely packed mitochondrial pellet will need a lower dilution. The extent of the dilution will depend on the animal, the oxidative nature of the skeletal muscle being isolated, and how densely packed the mitochondrial pellet is.
Having sufficient electrical power to support all equipment needed for data collection in a mobile laboratory can be challenging. Notably, the refrigerated centrifuge draws a high current during operation (especially during the initial phases of cooldown). Therefore, special considerations should be made to ensure that the electrical output of the vehicle matches the electrical demand of the equipment needed to run simultaneously. A recommendation that could resolve this limitation is the addition of more power sources (e.g., extra batteries, additional generators). Notably, the method of measuring mitochondrial respiration with permeabilized fibers does not need the use of a refrigerated centrifuge and could also provide a resolution to the limited power source. Environmental conditions and road quality should also be considered in the use of a mobile laboratory. The mobile mitochondrial physiology laboratory discussed herein was successfully driven on interstate roads with clear weather. Dirt roads with harsh weather will present greater difficulty in driving the vehicle to the location of interest. Although mitochondrial isolation is not a novel method, its use in a mobile laboratory provides a unique way to quantify mitochondrial energetics in free-living animals. This can be critical in elucidating the differences between laboratory and wild animals32,33,34. Additionally, the mobile mitochondrial physiology laboratory allows researchers to study energetic constraints and energetic extremes found among animals in the natural world.
Disclosures
The authors have no conflicts of interest to declare.
Acknowledgements
The authors acknowledge Mark Nelms and John Tennant from the Electrical and Computer Engineering department of the Samuel Ginn College of Engineering at Auburn University for helping with the structural and electrical outfitting of the AU MitoMobile. Additionally, the authors acknowledge the funding to outfit the AU MitoMobile and research from an Auburn University Presidential Awards for Interdisciplinary Research (PAIR) grant.
Materials
| Name | Company | Catalog Number | Comments |
|---|---|---|---|
| 1.7 mL centrifuge tubes | VWR | 87003-294 | |
| 2.0 mL centrifuge tubes | VWR | 87003-298 | |
| 50 mL centrifuge tubes | VWR | 21009-681 | Nalgene Oak Ridge Centrifuge Tube |
| ADP | VWR | 97061-104 | |
| ATP | VWR | 700009-070 | |
| Bradford | VWR | 7065-020 | |
| Clear 96 well plate | VWR | 82050-760 | Greiner Bio-One |
| Dounce homogenizer | VWR | 22877-284 | Corning |
| EGTA | VWR | EM-4100 | |
| Filter paper | Included with Hansatech OxyGraph | ||
| Free-fatty acid BSA | VWR | 89423-672 | |
| Glucose | VWR | BDH8005-500G | |
| Glutamate | VWR | A12919 | |
| Hamilton Syringes | VWR | 60373-985 | Gaslight 1700 Series Syringes |
| Hansatech OxyGraph | Hansatech Instruments Ltd | No Catalog Number, but can be found under Products --> Electrode Control Units | |
| KH2PO4 | VWR | 97062-350 | |
| Malate | VWR | 97062-140 | |
| Mannitol | VWR | 97061-052 | |
| Membrane | Included with Hansatech OxyGraph | ||
| MgCl2 | VWR | 97063-152 | |
| MOPS | VWR | 80503-004 | |
| Policeman | VWR | 470104-462 | |
| Polytron | Thomas Scientific | 11090044 | |
| Potassium chloride (KCl) | VWR | 97061-566 | |
| Protease | VWR | 97062-366 | Trypsin is commonly used; however, other proteases can be used. |
| Pyruvic acid | VWR | 97061-448 | |
| Sodium Dithionite | VWR | AA33381-22 | |
| Succinate | VWR | 89230-086 | |
| Sucrose | VWR | BDH0308-500G | |
| Tris-Base | VWR | 97061-794 | |
| Tris-HCl | VWR | 97061-258 |
References
- Toews, D. P., Mandic, M., Richards, J. G., Irwin, D. E. Migration, mitochondria, and the yellow-rumped warbler. Evolution. 68 (1), 241-255 (2014).
- Scott, G. R., Richards, J. G., Milsom, W. K. Control of respiration in flight muscle from the high-altitude bar-headed goose and low-altitude birds. American Journal of Physiology-Regulatory, Integrative and Comparative Physiology. 297 (4), 1066-1074 (2009).
- Kjeld, T., et al. Oxygen conserving mitochondrial adaptations in the skeletal muscles of breath hold divers. PLoS One. 13 (9), 0201401(2018).
- Hochachka, P., et al. Protective metabolic mechanisms during liver ischemia: transferable lessons from long-diving animals. Molecular and Cellular Biochemistry. 84 (1), 77-85 (1988).
- Muleme, H. M., Walpole, A. C., Staples, J. F. Mitochondrial metabolism in hibernation: metabolic suppression, temperature effects, and substrate preferences. Physiological and Biochemical Zoology. 79 (3), 474-483 (2006).
- Brown, J. C., Chung, D. J., Belgrave, K. R., Staples, J. F. Mitochondrial metabolic suppression and reactive oxygen species production in liver and skeletal muscle of hibernating thirteen-lined ground squirrels. American Journal of Physiology-Regulatory, Integrative and Comparative Physiology. 302 (1), 15-28 (2012).
- Daan, S., Masman, D., Groenewold, A. Avian basal metabolic rates: their association with body composition and energy expenditure in nature. American Journal of Physiology-Regulatory, Integrative and Comparative Physiology. 259 (2), 333-340 (1990).
- Thompson, S. D., Nicoll, M. E. Basal metabolic rate and energetics of reproduction in therian mammals. Nature. 321 (6071), 690-693 (1986).
- Stier, A., et al. Oxidative stress and mitochondrial responses to stress exposure suggest that king penguins are naturally equipped to resist stress. Scientific Reports. 9 (1), 8545(2019).
- Nicholls, D. G., Ferguson, S. J. Bioenergetics 3. Third edition. , Academic Press. (2002).
- Brand, M. D., Nicholls, D. G. Assessing mitochondrial dysfunction in cells. Biochemical Journal. 435 (2), 297-312 (2011).
- Mowry, A. V., Donoviel, Z. S., Kavazis, A. N., Hood, W. R. Mitochondrial function and bioenergetic trade-offs during lactation in the house mouse (Mus musculus). Ecology and Evolution. 7 (9), 2994-3005 (2017).
- Zhang, Y., et al. High activity before breeding improves reproductive performance by enhancing mitochondrial function and biogenesis. Journal of Experimental Biology. 221 (7), (2018).
- Zhang, Y., Humes, F., Almond, G., Kavazis, A. N., Hood, W. R. A mitohormetic response to pro-oxidant exposure in the house mouse. American Journal of Physiology-Regulatory, Integrative and Comparative Physiology. 314 (1), 122-134 (2018).
- Boutagy, N. E., et al. Isolation of mitochondria from minimal quantities of mouse skeletal muscle for high throughput microplate respiratory measurements. Journal of Visualized Experiments: JoVE. (105), e53217(2015).
- Djafarzadeh, S., Jakob, S. M. Isolation of intact mitochondria from skeletal muscle by differential centrifugation for high-resolution respirometry measurements. Journal of Visualized Experiments: JoVE. (121), e55251(2017).
- Garcia-Cazarin, M. L., Snider, N. N., Andrade, F. H. Mitochondrial isolation from skeletal muscle. Journal of Visualized Experiments: JoVE. (49), e2452(2011).
- Pravdic, D., et al. Complex I and ATP synthase mediate membrane depolarization and matrix acidification by isoflurane in mitochondria. European Journal of Pharmacology. 690 (1-3), 149-157 (2012).
- Brooks, S. P., Lampi, B. J., Bihun, C. G. The influence of euthanasia methods on rat liver metabolism. Journal of the American Association for Laboratory Animal Science. 38 (6), 19-24 (1999).
- Overmyer, K. A., Thonusin, C., Qi, N. R., Burant, C. F., Evans, C. R. Impact of anesthesia and euthanasia on metabolomics of mammalian tissues: studies in a C57BL/6J mouse model. PLoS One. 10 (2), 0117232(2015).
- Kuzmiak, S., Glancy, B., Sweazea, K. L., Willis, W. T. Mitochondrial function in sparrow pectoralis muscle. Journal of Experimental Biology. 215 (12), 2039-2050 (2012).
- Bradford, M. M. A rapid and sensitive method for the quantitation of microgram quantities of protein utilizing the principle of protein-dye binding. Analytical Biochemistry. 72 (1-2), 248-254 (1976).
- Figueiredo, P. A., et al. Impact of lifelong sedentary behavior on mitochondrial function of mice skeletal muscle. J Gerontol A Biol Sci Med Sci. 64 (9), 927-939 (2009).
- Scheibye-Knudsen, M., Quistorff, B. Regulation of mitochondrial respiration by inorganic phosphate; comparing permeabilized muscle fibers and isolated mitochondria prepared from type-1 and type-2 rat skeletal muscle. European Journal of Applied Physiology. 105 (2), 279-287 (2009).
- Kuznetsov, A. V., et al. Analysis of mitochondrial function in situ in permeabilized muscle fibers, tissues and cells. Nature Protocols. 3 (6), 965-976 (2008).
- Hughey, C. C., Hittel, D. S., Johnsen, V. L., Shearer, J. Respirometric oxidative phosphorylation assessment in saponin-permeabilized cardiac fibers. Journal of Visualized Experiments: JoVE. (48), e2431(2011).
- Gaviraghi, A., et al. Mechanical permeabilization as a new method for assessment of mitochondrial function in insect tissues. Mitochondrial Medicine. Vol. 2: Assessing Mitochonndria. , Springer US. 67-85 (2021).
- Hedges, C. P., Wilkinson, R. T., Devaux, J. B. L., Hickey, A. J. R. Hymenoptera flight muscle mitochondrial function: Increasing metabolic power increases oxidative stress. Comparative Biochemistry and Physiology Part A: Molecular & Integrative Physiology. 230, 115-121 (2019).
- Picard, M., Taivassalo, T., Gouspillou, G., Hepple, R. T. Mitochondria: isolation, structure and function. Journal of Physiology. 589 (18), 4413-4421 (2011).
- Picard, M., et al. Mitochondrial structure and function are disrupted by standard isolation methods. PLoS One. 6 (3), 18317(2011).
- Kuznetsov, A. V., et al. Analysis of mitochondrial function in situ in permeabilized muscle fibers, tissues and cells. Nature Protocols. 3 (6), 965(2008).
- Abolins, S., et al. The comparative immunology of wild and laboratory mice, Mus musculus domesticus. Nature Communications. 8, 14811(2017).
- Swart, J. A. The wild animal as a research animal. Journal of Agricultural and Environmental Ethics. 17 (2), 181-197 (2004).
- Calisi, R. M., Bentley, G. E. Lab and field experiments: Are they the same animal. Hormones and Behavior. 56 (1), 1-10 (2009).
Reprints and Permissions
