Imaging Integrin Tension and Cellular Force at Submicron Resolution with an Integrative Tension Sensor
Summary
Integrin tension plays important roles in various cell functions. With an integrative tension sensor, integrin tension is calibrated with picoNewton (pN) sensitivity and imaged at submicron resolution.
Abstract
Molecular tension transmitted by integrin-ligand bonds is the fundamental mechanical signal in the integrin pathway that plays significant roles in many cell functions and behaviors. To calibrate and image integrin tension with high force sensitivity and spatial resolution, we developed an integrative tension sensor (ITS), a DNA-based fluorescent tension sensor. The ITS is activated to fluoresce if sustaining a molecular tension, thus converting force to fluorescent signal at the molecular level. The tension threshold for ITS activation is tunable in the range of 10–60 pN that well covers the dynamic range of integrin tension in cells. On a substrate grafted with an ITS, the integrin tension of adherent cells is visualized by fluorescence and imaged at submicron resolution. The ITS is also compatible with cell structural imaging in both live cells and fixed cells. The ITS has been successfully applied to the study of platelet contraction and cell migration. This paper details the procedure for the synthesis and application of the ITS in the study of integrin-transmitted cellular force.
Introduction
Cells rely on integrins to adhere and exert cellular forces to extracellular matrix. Integrin-mediated cell adhesion and force transmission are crucial for cell spreading1,2, migration3,4, and survival5,6,7. In the long term, integrin biomechanical signaling also influences cell proliferation8,9,10 and differentiation11,12. Researchers have developed various methods to measure and map integrin-transmitted cellular forces at the cell-matrix interface. These methods are based on elastic substratum13, array of micropost14, or atomic force microscopy (AFM)15,16. Elastic substratum and micropost methods rely on the deformation of substrates to report the cellular stress and have limitations in terms of spatial resolution and force sensitivity. AFM has high force sensitivity, but it cannot detect force at multiple spots simultaneously, making it difficult to map cellular force transmitted by integrins.
In recent years, several techniques were developed to study cellular force at the molecular level. A collection of molecular tension sensors based on polyethylene glycol17,18, spider silk peptide19, and DNA20,21,22,23 were developed to visualize and monitor tension transmitted by molecular proteins. Among these techniques, DNA was first adopted as the synthesis material in the tension gauge tether (TGT), a rupturable linker that modulates the upper limit of integrin tensions in live cells22,24. Later, DNA and fluorescence resonance transfer technique were combined to create hairpin DNA-based fluorescent tension sensors first by Chen’s group23 and Salaita’s group20. The hairpin DNA-based tension sensor reports integrin tension in real-time and has been successfully applied to the study of a series of cellular functions21. Afterward, Wang’s lab combined a TGT with the fluorophore-quencher pair to report integrin tension. This sensor is named an ITS25,26. The ITS is based on double-stranded DNA (dsDNA) and has a broader dynamic range (10-60 pN) for integrin tension calibration. In contrast to hairpin DNA-based sensors, the ITS does not report cellular force in real-time but records all historic integrin events as the footprint of cellular force; this signal accumulation process improves the sensitivity for cellular force imaging, making it feasible to image cellular force even with a low-end fluorescence microscope. The synthesis of ITS is relatively more convenient as it is created by hybridizing two single-stranded DNAs (ssDNA).
The ITS is an 18-base-paired dsDNA conjugated with biotin, a fluorophore, a quencher (Black Hole Quencher 2 [BHQ2])27, and a cyclic arginylglycylaspartic acid (RGD) peptide28 as an integrin peptide ligand (Figure 1). The lower strand is conjugated with the fluorophore (Cy3 is used in this manuscript, while other dyes, such as Cy5 or Alexa series, have also been proven feasible in our lab) and the biotin tag, with which the ITS is immobilized on a substrate by biotin-avidin bond. The upper strand is conjugated with the RGD peptide and the Black Hole Quencher, which quenches Cy3 with approximately 98% quenching efficiency26,27. With the protocol presented in this paper, the coating density of the ITS on a substrate is around 1,100/µm2. This is the density we previously calibrated for 18 bp biotinylated dsDNA coated on the neutrAvidin-functionalized substrate by following the same coating protocol29. When cells adhere to the substrate coated with the ITS, integrin binds the ITS through RGD and transmits tension to the ITS. The ITS has a specific tension tolerance (Ttol) which is defined as the tension threshold that mechanically separates the dsDNA of the ITS within 2 s22. ITS rupture by integrin tension leads to the separation of the quencher from the dye that subsequently emits fluorescence. As a result, the invisible integrin tension is converted to a fluorescence signal and the cellular force can be mapped by fluorescence imaging.
To demonstrate the application of the ITS, we use fish keratocyte here, a widely used cell model for cell migration study30,31,32, CHO-K1 cell, a commonly used nonmotile cell line, and NIH 3T3 fibroblast. Coimaging of integrin tension and cell structures is also conducted.
Protocol
All methods described here have been approved by the Institutional Animal Care and Use Committee (IACUC, 8-16-8333-I) of Iowa State University.
1. Synthesis of the integrative tension sensor
- Customize and order ssDNAs (see the Table of Materials).
NOTE: The ssDNA sequences are as follows. The upper strand is /5ThioMC6-D/GGG AGG ACG CAG CGG GCC/3BHQ_2/. The lower strands are as follows.
12 pN ITS: /5Cy3/GGC CCG CTG CGT CCT CCC /3Bio/
23 pN ITS: /5Cy3/GGC CCG CTG CGT CC /iBiodT/ CCC
33 pN ITS: /5Cy3/GGC CCG CTG CG/iBiodT/ CCT CCC
43 pN ITS: /5Cy3/GGC CCG C/iBiodT/G CGT CCT CCC
54 pN ITS: /5Biosg//iCy3/GGC CCG CTG CGT CCT CCC
Here, /5ThioMC6-D/ represents a thiol modifier C6 S-S (disulfide) at the 5' end. /3BHQ_2/ represents a Black Hole Quencher 2 at the 3' end. /3Bio/, /5Biosg/, and /iBiodT/ are biotinylation at the 3' end, the 5' end, and on the thymine of internal DNA, respectively. /iCy3/ represents a Cy3 inserted into the internal backbone of ssDNA. These codes are used by the specific commercial supplier used here and may be different in other DNA companies. - Conjugate RGD peptide to the SH-ssDNA-quencher.
NOTE: The reagents used are phosphate-buffered saline (PBS), sulfosuccinimidyl 4-(N-maleimidomethyl)cyclohexane-1-carboxylate (sulfo-SMCC), RGD peptide, and tris-(2-carboxyethyl)phosphine hydrochloride, also known as TCEP-HCl.- Deprotect the thiol modifier on the upper strand DNA using TCEP solution.
NOTE: Thiol-modified DNAs ordered from a commercial source are shipped in oxidized form, with the sulfur atoms protected by a disulfide bond that needs be reduced prior to RGD-DNA conjugation. TCEP is an odorless reduction reagent used for the thiol deprotection.- Dissolve 14.3 mg of TCEP-HCl in 300 µL of water. Adjust the pH of the TCEP solution to ~7.2–7.4 with 1 M NaOH solution (about 150 µL), using pH test papers. Add pure water to make a final volume of 0.5 mL. The final TCEP concentration is 100 mM.
NOTE: It is recommended to make TCEP solution fresh every time for DNA thiol deprotection. Avoid stocking TCEP solution for a long time. - Add 100 µL of 0.5 M ethylenediaminetetraacetic acid (EDTA) solution and 400 µL of water to the TCEP solution.
- Add 10 µL of the TCEP+EDTA solution to 20 µL of 1 mM thiol-DNA-BHQ2 in PBS. Let the solution react for 30 min at room temperature.
NOTE: The disulfide bond of 5' thiol modifier C6 S-S conjugation at this ssDNA will be cleaved by TCEP, leaving the thiol group ready for reaction with maleimide in the next steps. The TCEP does not interfere with the following thiol-maleimide reaction; thus, it is not necessary to passivate TCEP after this step.
- Dissolve 14.3 mg of TCEP-HCl in 300 µL of water. Adjust the pH of the TCEP solution to ~7.2–7.4 with 1 M NaOH solution (about 150 µL), using pH test papers. Add pure water to make a final volume of 0.5 mL. The final TCEP concentration is 100 mM.
- Conjugate RGD-NH2 with sulfo-SMCC.
- Dissolve 5 mg of RGD-NH2 in 100 µL of PBS to obtain 11 mM RGD-NH2.
- Add 200 µL of pure water to the tube with 2 mg of sulfo-SMCC (premeasured by the supplier). Smash the sulfo-SMCC solid with a pipette tip and vigorously pipette at the same time to facilitate dissolving the SMCC in the water. The concentration of sulfo-SMCC will be 23 mM.
NOTE: Because the NHS ester in sulfo-SMCC is subject to hydrolysis and has a lifetime of a few minutes, this dissolving step should be completed within 1 min to avoid excessive loss of the NHS ester due to hydrolysis. Use pure water to dissolve sulfo-SMCC because its solubility in PBS or other buffers is poor. - Add 40 µL of sulfo-SMCC solution to the 100 µL RGD-NH2 solution and incubate it for 20 min.
NOTE: The NHS ester in sulfo-SMCC will react with the amine group in RGD-NH2, forming an amide bond that links RGD and sulfo-SMCC.
- Conjugate RGD-SMCC with the SH-ssDNA-quencher.
- Mix the solutions prepared in steps 1.2.1 and 1.2.2 and incubate the mixture for 1 h at room temperature. Move the solution to a refrigerator set at 4 °C and let it further react overnight. The thiol conjugated on the upper strand DNA will react with maleimide on sulfo-SMCC, forming a thioether group that links RGD with the upper strand DNA.
- Perform ethanol precipitation to purify RGD-ssDNA-quencher from unreacted sulfo-SMCC, RGD, and TCEP.
- Chill 10 mL of 100% ethanol in a 15 mL conical tube in a -20 °C freezer for at least 30 min.
- Mix a 3 M NaCl solution, a DNA solution, and chilled ethanol at a volume ratio of 1:10:25. Keep the mixed liquid in a -20 °C freezer for 30 min or until the DNA is precipitated.
- Centrifuge the liquid at 10,000 x g for 30 min. Discard the supernatant.
- Add PBS to the DNA pellet. Measure the DNA concentration using a spectrometer.
- (Optional) Perform DNA electrophoresis to gain a higher RGD-ssDNA purity.
NOTE: With the above protocol, about 70%–90% of the ssDNA will be conjugated with RGD. If higher purity is desired, DNA electrophoresis can also be performed to separate conjugated DNA from unconjugated DNA.- Assemble a vertical electrophoresis system.
- Prepare a 10% polyacrylamide gel solution by mixing 50 mL of pure water, 20 mL of 40% acrylamide gel, 8 mL of 10x tris-borate-EDTA (TBE) buffer and 800 µL of 10% ammonium persulfate (APS).
- Add 80 µL of tetramethylethylenediamine (TEMED) to the gel solution. Pour the solution into the glass chamber of the electrophoresis system. Insert a single-well comb to create a well on top of the gel. Wait for 10 min till the gel is crosslinked.
- Mix the DNA solution with 100% glycerol at a volume ratio of 1:1. Remove the comb and load the DNA solution to the gel well.
- Run the gel at a voltage of 200 V. Observe two DNA bands in which the lagging one is the conjugated DNA.
- Cut the gel band with the conjugated DNA off and dice it into small pieces.
- Collect the diced gel in two 1.5 mL centrifuge tubes with filters. Add 500 µL of PBS to each tube.
- Put the PBS-soaked gel in a dark place at room temperature for 1 day. DNA will diffuse out of the gel pieces into the PBS.
- Collect the DNA solution by centrifuging the tubes at 1,000 x g for 2 min.
- Perform another round of ethanol precipitation (step 1.2.4) to collect the DNA.
- Deprotect the thiol modifier on the upper strand DNA using TCEP solution.
- Synthesize the ITS by hybridizing RGD-ssDNA-quencher and dye-ssDNA-biotin.
- Mix the solutions of the upper strand and the lower strand DNAs at a molar ratio of 1.1:1. Keep the mixture at 4 °C overnight to produce the ITS by DNA hybridization.
NOTE: A molar ratio of 1.1:1 for DNA hybridization is used instead of 1:1. Excessive RGD-ssDNA-quencher is used to ensure that all dye-ssDNA-biotin will hybridize with RGD-ssDNA-quencher. RGD-ssDNA-quencher without hybridization will be washed off during surface coating, which will not affect the ITS surface coating quality. - Aliquot and store the ITS solution at -20 °C for long term storage.
NOTE: The storage buffer is PBS and the storage concentration should generally be above 10 µM. For regular use, ITS solution can be stored at 4 °C for a few weeks without noticeable quality deterioration.
- Mix the solutions of the upper strand and the lower strand DNAs at a molar ratio of 1.1:1. Keep the mixture at 4 °C overnight to produce the ITS by DNA hybridization.
2. Preparation of ITS surfaces by immobilizing the ITS on glass-bottomed Petri dishes
NOTE: The reagents used are biotinylated bovine serum albumin (BSA-biotin), avidin protein, and ITS. Chill all reagents and PBS buffer to around 0 °C on ice with an ice bucket.
- Load 200 µL of 0.1 mg/mL BSA-biotin in PBS onto the well of a glass-bottomed Petri dish (29 mm in diameter, with a 14 mm well). Incubate it for 30 min at 4 °C in a refrigerator. BSA-biotin is physically adsorbed on the glass surface.
- Suck out the solution from the well using a pipette and add 200 µL of PBS back to the well to wash the surface. Repeat this 3x to complete the washing.
- Incubate 200 µL of 50 µg/mL avidin protein in the well for 30 min at 4 °C. Wash it 3x with PBS. After this step, the avidin protein binds to the BSA-biotin and becomes immobilized on the glass surface.
- Incubate 200 µL of 0.1 µM ITS in the well for 30 min at 4 °C. Wash the dish with 3x with PBS. Leave PBS in the well until the cell plating. After this step, the ITS with the biotin tag binds to the avidin protein and becomes immobilized on the surface.
NOTE: One precaution critical for ITS coating quality and homogeneity during the ITS immobilization is to never let the Petri dish surface dry up. Keeping all reagents and PBS at 4 °C or around 0 °C on ice with an ice bucket helps to reduce the water evaporation rate during the washing steps, when PBS is drawn out from the well.
3. Cell plating onto ITS surfaces
- Culture fish keratocytes.
NOTE: Here, goldfish (Carassius auratus) is used as an example, but other fish species may also work.- Pluck a piece of fish scale from a fish with a flat-tip tweezer. Gently press the scale onto the well of a glass-bottomed Petri dish, with the inner side of the scale contacting the glass. Wait for ~30 s for the fish scale to adhere well to the glass surface of the dish.
- Add 1 mL of Iscove’s modified Dulbecco’s medium (IMDM) complete medium to fully cover the fish scale. Keep the Petri dish in a dark and humid box for 6–48 h at room temperature.
NOTE: IMDM complete medium contains 79% IMDM + 20% fetal bovine serum (FBS) + 1% penicillin. No extra supply of oxygen or CO2 is needed. A few tissue paper rolls soaked with water can be left in the box to maintain high humidity in the box. Fish keratocytes will migrate out of the fish scale as a sheet of cells after a few hours. This can be observed with a tissue culture microscope. The cells are generally viable at 48 h.
- Detach and plate the keratocytes cells on ITS surfaces.
- Remove the medium from the Petri dish in which the fish scale was cultured. Wash the well 1x with cell detaching solution, and add detaching solution to cover the fish scale and incubate for 3 min.
NOTE: The recipe for the cell detaching EDTA solution is as follows: 100 mL of 10x Hanks' Balanced Salt Solution (HBSS) + 10 mL of 1 M HEPES (pH 7.6) + 10 mL of 7.5% sodium bicarbonate + 2.4 mL of 500 mM EDTA +1 L of H2O. The pH is adjusted to 7.4. - Suck out all cell detaching solution and add IMDM complete medium. Disperse the keratocytes by gentle pipetting. Adjust the cell solution density to the desired level (1 x 10⁴–1 x 10⁵/mL). Plate the cells on the ITS surface (prepared according to section 2). Incubate the cells at room temperature for 30 min before imaging.
NOTE: Cell counting can be done with a hemocytometer after detaching the cells with detaching solution. The cell plating density is relatively low so that the keratocytes have plenty of surface area to migrate.
- Remove the medium from the Petri dish in which the fish scale was cultured. Wash the well 1x with cell detaching solution, and add detaching solution to cover the fish scale and incubate for 3 min.
- Plate CHO-K1 cells and NIH 3T3 cells on ITS surfaces.
NOTE: The medium for CHO-K1 cells is 89% Ham’s F12 + 10% FBS + 1% penicillin. The medium for NIH 3T3 cells is 89% Dulbecco’s modified Eagle’s medium (DMEM) + 10% calf bovine serum (CBS) + 1% penicillin. The culture conditions are 37 °C and 5% CO2.- Culture CHO-K1 cells or NIH 3T3 cells to 80%–100% confluence in a Petri dish (or culture flask).
- Warm the cell detaching solution and culture medium to 37 °C.
- Remove all culture medium in the Petri dish with a pipette. Wash the cells 1x with cell detaching solution. Cover the cells with detaching solution and incubate it at 37 °C for 10 min.
- Disperse the cells by pipetting. Collect the cell solution and centrifuge it at 300 x g for 3 min.
- Suck out the supernatant and add complete medium or serum-free medium.
- Adjust the cell solution density to the desired level (1 x 10⁵ – 1 x 10⁶/mL). Plate the cells on the ITS surfaces (prepared according to section 2). Incubate the cells at 37 °C for 1–2 h before imaging, or 30 min before video recording.
4. Imaging, video recording, and real-time integrin tension mapping
- Quasi-real-time imaging of integrin tension in live cells
- Incubate keratocytes on ITS surfaces (prepared according to section 2) for 30 min at room temperature, or incubate CHO-K1 cells or NIH 3T3 cells for 1 h on ITS surfaces in an incubator at 37 °C.
- Mount the Petri dish on a fluorescence microscope stage. Perform cellular force imaging with an exposure time of 1 s. The magnification is 40x or 100x.
- Take a video of ITS images with a frame interval of 20 s for keratocytes, or 1–2 min for CHO-K1 cells or NIH 3T3 cells.
- Use MATLAB or another image analysis tool to subtract a previous frame of the ITS video from a current frame to compute the ITS signal newly produced in the latest frame interval. The newly produced ITS signal represents the integrin tension generated in the latest frame interval, thereby reporting the cellular force in a quasi-real-time manner.
- Coimaging of integrin tension and cellular structure in immunostained cells
- After step 3.2.2 or step 3.3.6, perform immunostaining to mark the target structural proteins.
NOTE: Use different dyes to avoid the fluorescence crosstalk between integrin tension imaging and cell structural imaging. In this manuscript, Cy5 fluorophore was used for phalloidin and Alexa 488 was used for vinculin staining. The concentration of both primary and secondary antibody is 2.5 µg/mL. The concentration for phalloidin is 1.5 units/µL. - Perform multifluorescent channel imaging to acquire both an integrin tension map and cell structural imaging.
- After step 3.2.2 or step 3.3.6, perform immunostaining to mark the target structural proteins.
Representative Results
With the ITS, the integrin tension map of fish keratocytes was captured. It shows that a keratocyte migrates and generates integrin tension at two force tracks (Figure 2A). The resolution of the force map was calibrated to be 0.4 µm (Figure 2B). High integrin tension concentrates at the rear margin (Figure 3A). The ITS also shows different specific patterns of different cells. A nonmotile cell, NIH-3T3, forms a specific integrin tension pattern (Figure 3B) quite different from that of the fast migrating keratocyte.
With immunostaining, focal adhesions and the integrin tension of fish keratocytes were coimaged (Figure 4A). The relation between integrin tension and cell structure in keratocytes was studied in detail by Wang et al.25. Integrin tension and stress fibers in CHO-K1 cells were also coimaged (Figure 4B). These experiments indicate that the ITS enables the coimaging of cell adhesion force and cell structures simultaneously under similar imaging settings, thereby facilitating the study of cell structure/force interplay.
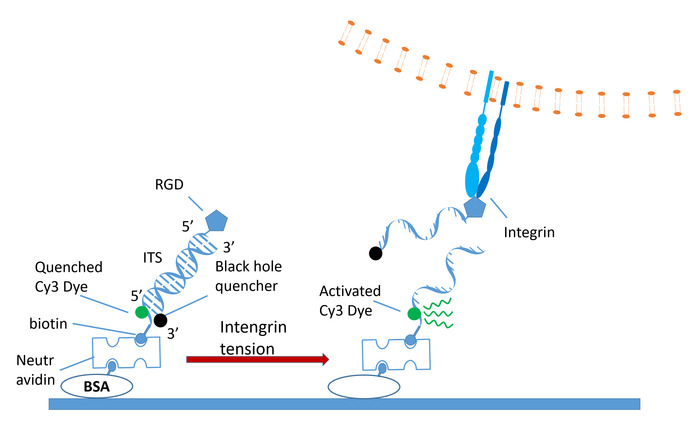
Figure 1: Schematics of the ITS. The ITS is a dsDNA decorated with an RGD ligand, a fluorescence quencher, a dye, and a biotin tag. The dye (green-filled circle) is quenched by the quencher. Under integrin tension, the dsDNA is ruptured and Cy3 is freed from quenching and emits fluorescence that can be detected by fluorescent microscopy. Please click here to view a larger version of this figure.
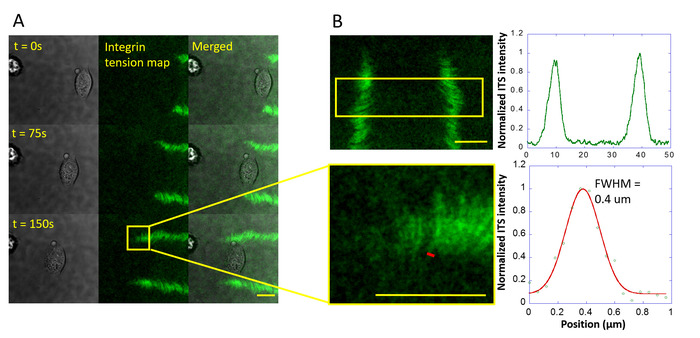
Figure 2: Integrin tension map of a fish keratocyte and the submicron resolution of the ITS. (A) During fast migration, a keratocyte consistently generates an integrin tension map in two force tracks. (B) The distance between the two force tracks is typically 40 µm. The spatial resolution of the cellular force map imaged by the ITS is around 0.4 µm. The linear profile of the Cy3 fluorescent intensity of the area marked by a short red line in the lower left panel is calculated for the calibration of the resolution in cellular force imaging. The result is shown in the lower right panel and fitted with a Gaussian curve. The scale bar = 10 µm. Please click here to view a larger version of this figure.
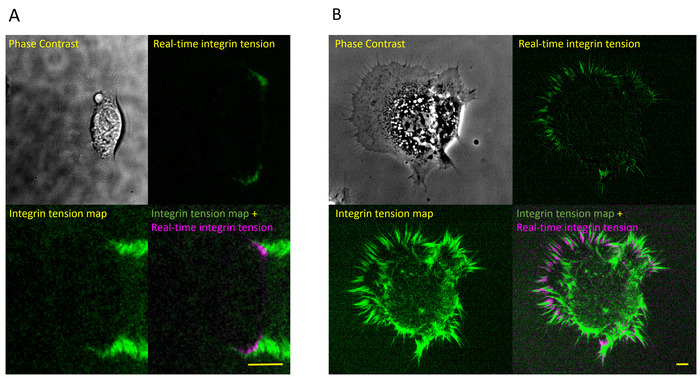
Figure 3: Real-time integrin tension map of a fish keratocyte and NIH-3T3. (A) A fish keratocyte and its integrin tension map. (Upper left) A motile fish keratocyte. (Lower left) Integrin tension map of the keratocyte reported by the ITS. (Upper right) Real-time integrin tension was obtained by frame subtraction. It shows that the newly generated integrin tension is colocalized with the cell rear edge. (Lower right) Integrin tension map (green) and real-time integrin tension (magenta) are presented in one merged figure. The scale bar = 10 µm. (B) An NIH-3T3 fibroblast and its integrin tension map. (Upper left) An NIH-3T3 fibroblast. (Lower left) Integrin tension map of the NIH-3T3 fibroblast. Integrin tension was generated in a stripe pattern. (Upper right) Real-time integrin tension shows that newly generated integrin tension mainly forms at the cell peripheral region. (Lower right) Integrin tension map (green) and real-time integrin tension (magenta) are presented in one merged figure. The scale bar = 10 µm. Please click here to view a larger version of this figure.
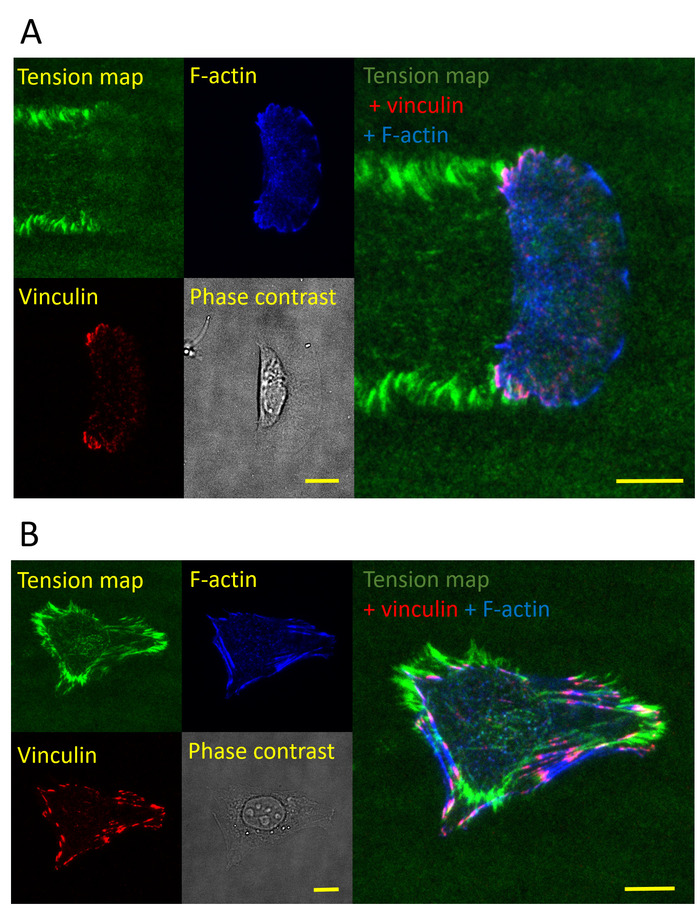
Figure 4: Coimaging of integrin tension and cell structure. (A) Coimaging of integrin tension, vinculin, and F-actin in a keratocyte. The keratocyte was fixed and immunostained to report vinculin and F-actin. (B) Coimaging of integrin tension, vinculin, and F-actin in a CHO-K1 cell. The scale bar = 10 µm. Please click here to view a larger version of this figure.
Discussion
The ITS is a highly accessible yet powerful technique for cellular force mapping in terms of both synthesis and application. With all materials ready, the ITS can be synthesized within 1 day. During experiments, only three steps of surface coating are needed prior to cell plating. Recently, we further simplified the coating procedure to one step by directly linking the ITS to bovine serum albumin, which enables direct physical adsorption of the ITS to glass or polystyrene surfaces33. The ITS brings the fluorescent intensity of cellular force signal to a comparable level of cellular structural imaging. The convenient synthesis and sample preparation, modest requirements for microscopy, and high sensitivity for cellular force make the ITS a robust and reliable technique for the study of cell mechanics. In this paper, we presented a comprehensive procedure for ITS synthesis and application.
Conjugating RGD ligand with ssDNA is the most critical procedure in the ITS synthesis. As mentioned in the protocol section, the NHS ester on sulfo-SMCC is not stable in water. The longer it takes to dissolve sulfo-SMCC in water, the more amount of sulfo-SMCC loses NHS ester to hydrolysis and becomes “dud”, which conjugates with DNA through the maleimide-thiol reaction but fails to conjugate with RGD-NH2. As a result, a big portion of DNA molecules will be occupied by the dead sulfo-SMCC and cannot link with RGD, leading to a low yield of ssDNA-RGD. For this reason, dissolving the sulfo-SMCC in water should be completed quickly, generally within 1 min. It is also recommended to check the yield of ssDNA-RGD with electrophoresis. If the yield is higher than 80%, purification is generally unnecessary. Otherwise, DNA purification by polyacrylamide gel is recommended. The recovery rate of DNA by polyacrylamide gel is about 60%–80%.
To synthesize a reasonable amount of RGD-ssDNA-BHQ2, the starting amount of thiol-ssDNA-BHQ2 should be at least 20 nmol (1 mM x 20 µL). Note that DNA modifications significantly reduce the quantity of the ssDNA ordered from DNA companies. For example, if 1,000 nmol of ssDNA with two modifications is ordered, the guaranteed yield may only be 20 nmol. If this is the case, order at least 1,000 nmol of ssDNA for the RGD-ssDNA conjugation. Researchers can also design their own sequences for ITS constructs. Normally, we keep the GC content in the ITS higher than 70% to improve the dsDNA thermal stability. DNA sequence analysis can be performed to minimize the probability of forming self-hairpin, self-hybridization, stable secondary structure, etc. The analysis tool is available online. In the manuscript, the upper strand DNA is the same for ITSs with different Ttol. We vary the biotin location at the lower strand DNA to achieve a different Ttol. However, varying the location of RGD on the upper strand can be also applied to tune the Ttol of the ITS. The calculation of Ttol for a different dsDNA geometry is provided by Wang and Ha22 and Mosayebi et al.34, especially for the dsDNA in the unzipping mode35,36 and the shear mode37,38.
Although ITS surfaces record all integrin tensions that have taken place in the past, by recording a video of the cellular force map consecutively, researchers can compute the integrin tension produced in the latest frame interval by subtracting the previous frame from a current frame to generate the ‘quasi-real-time cellular force map’. The frame interval in the ITS video varies depending on the cell types but is usually 20 s for fast migrating cells and 1–2 min for stationary cells. The frame subtraction method reports the quasi-real-time integrin tension while retaining the high sensitivity for integrin tension imaging due to the signal accumulation effect. Photobleaching is minimal between two consecutive images and, therefore, has no observable influence to the frame subtraction method.
Divulgazioni
The authors have nothing to disclose.
Acknowledgements
This work was supported by the startup fund provided by Iowa State University and by the National Institute of General Medical Sciences (R35GM128747).
Materials
| BSA-biotin | Sigma-Aldrich | A8549 | |
| Neutravidin | Thermo Fisher Scientific | 31000 | |
| Streptavidin | Thermo Fisher Scientific | 434301 | |
| upper strand DNA | Integrated DNA Technologies | N/A | Customer designed. DNA sequence is shown in PROTOCOL section |
| lower strand DNA | Integrated DNA Technologies | N/A | Customer designed. DNA sequences are shown in PROTOCOL section. |
| sulfo-SMCC | Thermo Fisher Scientific | A39268 | |
| Cyclic peptide RGD with an amine group | Peptides International | PCI-3696-PI | |
| IMDM | ATCC | 62996227 | |
| FBS | ATCC | 302020 | |
| Penicillin | gibco | 15140122 | |
| TCEP | Sigma-Aldrich | C4706 | |
| 200 uL petri dish | Cellvis | D29-14-1.5-N | |
| NanoDrop 2000 | Thermo Scientific | N/A | spectrometer |
| SE410 Tall Air-Cooled Vertical Protein Electrophoresis Unit | Hoefer | SE410-15-1.5 | Device for electroporesis |
| CHO-K1 cell line | ATCC | CCL-61 | |
| NIH/3T3 cell line | ATCC | CRL-1658 | |
| Anti-Vinculin Antibody | EMD Millipore | 90227 | Primary antibody for vinculin immunostaining |
| Goat anti-Mouse IgG (H+L) Superclonal Secondary Antibody, Alexa Fluor 488 | Invitrogen | A28175 | Secondary antibody for vinculin immunostaining |
| Alexa Fluor 647 Phalloidin | Invitrogen | A22287 | |
| Eclipse Ti | Nikon | N/A | microscope |
Riferimenti
- Price, L. S., Leng, J., Schwartz, M. A., Bokoch, G. M. Activation of Rac and Cdc42 by Integrins Mediates Cell Spreading. Molecular Biology of the Cell. 9 (7), 1863-1871 (1998).
- Cavalcanti-Adam, E. A., et al. Cell Spreading and Focal Adhesion Dynamics Are Regulated by Spacing of Integrin Ligands. Biophysical Journal. 92 (8), 2964-2974 (2007).
- Huttenlocher, A., Horwitz, A. R. Integrins in cell migration. Cold Spring Harbor Perspectives in Biology. 3 (9), a005074 (2011).
- Hood, J. D., Cheresh, D. A. Role of integrins in cell invasion and migration. Nature Reviews Cancer. 2 (2), 91-100 (2002).
- Giancotti, F. G. Integrin signaling: specificity and control of cell survival and cell cycle progression. Current Opinion in Cell Biology. 9 (5), 691-700 (1997).
- Illario, M., et al. Integrin-Dependent Cell Growth and Survival Are Mediated by Different Signals in Thyroid Cells. The Journal of Clinical Endocrinology & Metabolism. 88 (1), 260-269 (2003).
- Aoudjit, F., Vuori, K. Integrin Signaling in Cancer Cell Survival and Chemoresistance. Chemotherapy Research and Practice. 2012, 1-16 (2012).
- Hou, S., et al. Distinct effects of β1 integrin on cell proliferation and cellular signaling in MDA-MB-231 breast cancer cells. Scientific Reports. 6, 18430 (2016).
- Shankar, G., Davison, I., Helfrich, M. H., Mason, W. T., Horton, M. A. Integrin receptor-mediated mobilisation of intranuclear calcium in rat osteoclasts. Journal of Cell Science. 105 (Pt 1) (1), 61-68 (1993).
- Moreno-Layseca, P., Streuli, C. H. Signalling pathways linking integrins with cell cycle progression. Matrix Biology. 34, 144-153 (2014).
- Gómez-Lamarca, M. J., Cobreros-Reguera, L., Ibáñez-Jiménez, B., Palacios, I. M., Martín-Bermudo, M. D. Integrins regulate epithelial cell differentiation by modulating Notch activity. Journal of Cell Science. 127 (Pt 1), 4667-4678 (2014).
- Wang, H., Luo, X., Leighton, J. Extracellular Matrix and Integrins in Embryonic Stem Cell Differentiation. Biochemistry Insights. 8 (Suppl 1), 15-21 (2015).
- Schwarz, U. S., Soiné, J. R. D. Traction force microscopy on soft elastic substrates: A guide to recent computational advances. Biochimica et Biophysica Acta (BBA) – Molecular Cell Research. 1853 (11), 3095-3104 (2015).
- Xie, T., Hawkins, J., Sun, Y., Rittié, L. Traction Force Measurement Using Deformable Microposts. Fibrosis. Methods and Protocols. , 235-244 (2017).
- Radmacher, M. Studying the Mechanics of Cellular Processes by Atomic Force Microscopy. Methods in Cell Biology. 83, 347-372 (2007).
- Charras, G. T., Lehenkari, P. P., Horton, M. A. Atomic force microscopy can be used to mechanically stimulate osteoblasts and evaluate cellular strain distributions. Ultramicroscopy. 86 (1-2), 85-95 (2001).
- Miller, J. S., et al. Bioactive hydrogels made from step-growth derived PEG-peptide macromers. Biomaterials. 31 (13), 3736-3743 (2010).
- Legant, W. R., Miller, J. S., Blakely, B. L., Cohen, D. M., Genin, G. M., Chen, C. S. Measurement of mechanical tractions exerted by cells within three-dimensional matrices. Nature Methods. 7 (12), 969 (2010).
- Brenner, M. D., et al. Spider Silk Peptide Is a Compact, Linear Nanospring Ideal for Intracellular Tension Sensing. Nano Letters. 16 (3), 2096-2102 (2016).
- Zhang, Y., Ge, C., Zhu, C., Salaita, K. DNA-based digital tension probes reveal integrin forces during early cell adhesion. Nature Communications. 5, 5167 (2014).
- Liu, Y., et al. DNA-based nanoparticle tension sensors reveal that T-cell receptors transmit defined pN forces to their antigens for enhanced fidelity. Proceedings of the National Academy of Sciences of the United States of America. 113 (20), 5610-5615 (2016).
- Wang, X., Ha, T. Defining Single Molecular Forces Required to Activate Integrin and Notch Signaling. Science. 340 (6135), (2013).
- Blakely, B. L., et al. A DNA-based molecular probe for optically reporting cellular traction forces. Nature Methods. 11 (12), 1229-1232 (2014).
- Wang, Y., Wang, X. Integrins outside focal adhesions transmit tensions during stable cell adhesion. Scientific Reports. 6 (1), 36959 (2016).
- Wang, Y., et al. Force-activatable biosensor enables single platelet force mapping directly by fluorescence imaging. Biosensors and Bioelectronics. 100, 192-200 (2018).
- Zhao, Y., Wang, Y., Sarkar, A., Wang, X. Keratocytes Generate High Integrin Tension at the Trailing Edge to Mediate Rear De-adhesion during Rapid Cell Migration. iScience. 9, 502-512 (2018).
- Crisalli, P., Kool, E. T. Multi-Path Quenchers: Efficient Quenching of Common Fluorophores. Bioconjugate Chemistry. 22 (11), 2345-2354 (2011).
- Mondal, G., Barui, S., Chaudhuri, A. The relationship between the cyclic-RGDfK ligand and αvβ3 integrin receptor. Biomaterials. 34 (26), 6249-6260 (2013).
- Wang, X., et al. Integrin Molecular Tension within Motile Focal Adhesions. Biophysical Journal. 109 (11), 2259-2267 (2015).
- Euteneuer, U., Schliwa, M. Persistent, directional motility of cells and cytoplasmic fragments in the absence of microtubules. Nature. 310 (5972), 58-61 (1984).
- Kucik, D. F., Elson, E. L., Sheetz, M. P. Cell migration does not produce membrane flow. The Journal of Cell Biology. 111 (4), 1617-1622 (1990).
- Mueller, J., et al. Load Adaptation of Lamellipodial Actin Networks. Cell. , (2017).
- Sarkar, A., Zhao, Y., Wang, Y., Wang, X. Force-activatable coating enables high-resolution cellular force imaging directly on regular cell culture surfaces. Physical Biology. 15 (6), 065002 (2018).
- Mosayebi, M., Louis, A. A., Doye, J. P. K., Ouldridge, T. E. Force-Induced Rupture of a DNA Duplex: From Fundamentals to Force Sensors. ACS Nano. 9 (12), 11993-12003 (2015).
- Bockelmann, U., Essevaz-Roulet, B., Heslot, F. Molecular Stick-Slip Motion Revealed by Opening DNA with Piconewton Forces. Physical Review Letters. 79 (22), 4489-4492 (1997).
- Krautbauer, R., Rief, M., Gaub, H. E. Unzipping DNA oligomers. Nano Letters. 3 (4), 493-496 (2003).
- de Gennes, P. G. Maximum pull out force on DNA hybrids. Comptes Rendus de l’Académie des Sciences – Series IV – Physics. 2 (10), 1505-1508 (2001).
- Hatch, K., Danilowicz, C., Coljee, V., Prentiss, M. Demonstration that the shear force required to separate short double-stranded DNA does not increase significantly with sequence length for sequences longer than 25 base pairs. Physical Review E. 78 (1), 011920 (2008).
