Mammalian Cell Division in 3D Matrices via Quantitative Confocal Reflection Microscopy
Summary
This protocol efficiently studies mammalian cell division in 3D collagen matrices by integrating synchronization of cell division, monitoring of division events in 3D matrices using live-cell imaging technique, time-resolved confocal reflection microscopy and quantitative imaging analysis.
Abstract
The study of how mammalian cell division is regulated in a 3D environment remains largely unexplored despite its physiological relevance and therapeutic significance. Possible reasons for the lack of exploration are the experimental limitations and technical challenges that render the study of cell division in 3D culture inefficient. Here, we describe an imaging-based method to efficiently study mammalian cell division and cell-matrix interactions in 3D collagen matrices. Cells labeled with fluorescent H2B are synchronized using the combination of thymidine blocking and nocodazole treatment, followed by a mechanical shake-off technique. Synchronized cells are then embedded into a 3D collagen matrix. Cell division is monitored using live-cell microscopy. The deformation of collagen fibers during and after cell division, which is an indicator of cell-matrix interaction, can be monitored and quantified using quantitative confocal reflection microscopy. The method provides an efficient and general approach to study mammalian cell division and cell-matrix interactions in a physiologically relevant 3D environment. This approach not only provides novel insights into the molecular basis of the development of normal tissue and diseases, but also allows for the design of novel diagnostic and therapeutic approaches.
Introduction
Cell mitosis is a critical event in cellular life, the regulation of which plays crucial roles in tissue and organ development. Abnormal mitosis is implicated in natural genetic variations, human aging processes, and the progression of cancer1,2,3,4,5. The increased rate of proliferation of tumor cells compared with normal cells is one of the hallmarks of cancer, despite the fact that cell behaviors are quite heterogeneous among different types of tumors and even among patients. In spite of promising preclinical results, some newly-developed antimitotic drugs have not shown to be effective in clinical trials6,7,8,9,10,11.The relevance of experimental and preclinical models has to be considered. Many types of normal mammalian and cancer cells divide in three-dimensional (3D) matrices, such as fibroblasts and fibrosarcoma cells in collagen I-rich 3D connective tissues, and metastatic cancer cells in the 3D stromal extracellular matrix (ECM). However, the vast majority of mammalian cell division experiments and assays have been performed on cells cultured on two-dimensional (2D) substrates. An engineered 3D matrix could better recapitulate the microstructure, mechanical properties, and biochemical signals of the 3D ECM of both normal and pathologic tissues12,13,14,15,16,17.
The study of how mammalian cell division is regulated in 3D environments remains largely unexplored despite both the physiological relevance and the therapeutic significance18,19. Possible reasons include the technical difficulties and experimental challenges associated with studying cell division in 3D matrices. Cell mitosis constitutes a small temporal fraction in the whole cell cycle20. Previous work has shown that the proliferation rate of many mammalian cells, such as human breast adenocarcinoma MCF-7, human osteosarcoma U2OS, and human liver HepG2, is much lower in 3D matrices compared with their counterparts on 2D substrates21,22. Furthermore, cells embedded in 3D matrices move in and out of focus during live-cell imaging. All of these factors contribute to the extremely low efficiency of capturing cell-division events in 3D culture using imaging techniques.
Interactions between the ECM and cells play critical roles in regulating cell divisions. Here, we describe an approach to efficiently study mammalian cell division in 3D collagen matrices. The method includes the incorporation of mitotic markers to the cells, synchronization of cell division, as well as the monitoring of division events in 3D matrices using the live-cell imaging technique, time-resolved confocal reflection microscopy, and quantitative imaging analysis. Fluorescence-labeled histone protein H2B is first introduced into the cells as a marker to differentiate mitotic and interphase cells. Then the cells are synchronized using the combination of thymidine blocking and nocodazole treatment, followed by a mechanical shake-off technique. Synchronized cells are then directly encapsulated into 3D collagen matrices. Cell division events of multiple cells are monitored efficiently using low-magnification time-lapse live-cell imaging. The deformation of collagen fibers, which is an indicator of cell-matrix interaction, is monitored using confocal reflection microscopy at high-magnification.
We have previously used this technique to monitor and quantify cell-matrix interaction before, during and after the mitosis of two metastatic cancer cell lines, human invasive ductal carcinoma MDA-MB-231 and human fibrosarcoma HT1080 cells, in 3D collagen matrices19. The methods presented here provide an efficient and general approach to study both mammalian cell division in a 3D environment and cell-matrix interactions. The MDA-MB-231 cell line is used as an example throughout the paper. This protocol provides novel insights into the molecular basis of the development of normal tissue and diseases, and could also allow for the design of novel diagnostic and therapeutic approaches.
Protocol
The protocol provided follows the guidelines of The Homewood Institutional Review Board (HIRB).
1. Stable Expression of H2B-mCherry as a Marker for Cell Mitosis
- Generation of lentiviral particles from human embryonic kidney 293T (HEK 293T) cells
- Plate the HEK 293T cells on a 10 cm cell culture dish at the density of 5 x 10⁶ cells/dish in cell culture medium (Dulbecco's Modified Eagle's Medium (DMEM) containing high glucose (4.5 g/L), sodium pyruvate, 10% Fetal Bovine Serum (FBS), and 1% penicillin-streptomycin (Pen/Strep)). Incubate for 24 h at 37 °C and 5% carbon dioxide (CO2). The desired confluency of the cells on the day of transfection is about 70 – 80%.
NOTE: HEK 293T cells are used here to produce viral particles, which will be used later to transduce MDA-MB-231 cells in order to generate a cell line stably expressing H2B-mCherry. Make sure that cells are evenly distributed throughout the plate. Addition of the cells drop wise to the plate, and gently moving the plate back and forth can aid in even distribution. Cells can also be seeded in plates or flasks of other sizes, which will result in the collection of different volumes of viral particles. - Transfect the HEK 293T cells using a transfection reagent with three plasmids (lentiviral vector, CMV ΔR 8.91, and pMDG-VSVG). The plasmid encoding H2B-mCherry is cloned in a lentiviral vector with phosphoglycerate kinase promoter (PGK). CMV ΔR 8.91 contains three required HIV genes, gag, pol, and rev. pMDG-VSVG contains the VSV-G envelope gene.
NOTE: There are multiple transfection agents to choose from.- Allow the vial of transfection reagent to reach room temperature (RT) before use. Invert or vortex the vial briefly.
- Mix 16 µg of DNA, which consists of 6 µg of H2B-mCherry plasmid, 8 µg of CMV ΔR 8.91, and 2 µg of pMDG-VSVG, in 1 mL of reduced serum media. Incubate at RT for 5 min.
NOTE: The amount and ratio of the three vectors is varied and optimized for different lentiviral transfer vectors. - Add 48 µL (use 1:3 ratio of DNA: transfection reagent) of the transfection reagent into the above DNA solution, and then incubate at RT for at least 15 min.
NOTE: The ratio of the DNA vs. transfection reagent is varied and optimized for different lentiviral transfer vectors. Make sure that the transfection reagent does not contact the side of the 1.5 mL centrifuge tube. - Add the DNA-lipid complex solution made in step 1.1.2.3 drop-wise to the cells. Gently swirl the plate to ensure the even distribution of the complex in the plate.
- Approximately 6 h after transfection, aspirate the medium and add fresh cell culture medium (DMEM with high glucose (4.5 g/L), sodium pyruvate, 10% FBS, and 1% Pen/Strep).
- Harvest the supernatant 24, 48, and 72 h post-transfection. Replace the medium after each harvest (DMEM, 4.5 g/L glucose, sodium pyruvate, with 10% FBS, and 1% Pen/Strep).
- Filter the lentiviral particles through a 0.45 µm filter to remove the cellular debris. Alternatively, spin down the supernatant to separate out the cell debris. The supernatant can be used for transduction right away, or can be stored at -80 °C.
- Plate the HEK 293T cells on a 10 cm cell culture dish at the density of 5 x 10⁶ cells/dish in cell culture medium (Dulbecco's Modified Eagle's Medium (DMEM) containing high glucose (4.5 g/L), sodium pyruvate, 10% Fetal Bovine Serum (FBS), and 1% penicillin-streptomycin (Pen/Strep)). Incubate for 24 h at 37 °C and 5% carbon dioxide (CO2). The desired confluency of the cells on the day of transfection is about 70 – 80%.
- Generation of cell lines stably expressing H2B-mCherry
NOTE: This protocol is described in detail for MDA-MB-231 cells. Before use in the experiment, human breast carcinoma cells MDA-MB-231 (Physical Sciences Oncology Center, NIH) are cultured in DMEM containing high glucose (4.5 g/L), sodium pyruvate, 10% FBS, and 1% Pen/Strep.- Plate the MDA-MB-231 cells at the density of 1 x 10⁵ cells in a 35 mm culture dish.
NOTE: The density of plating for different cell lines should be optimized, and therefore may be different from the optimal density for the MDA-MB-231 cells. - 24 h after plating the cells, add 1 mL of virus and 1 mL of fresh medium (DMEM, high glucose (4.5 g/L), sodium pyruvate, 10% FBS, and 1% Pen/Strep).
- Incubate the cells for a time period of 6 h to overnight.
NOTE: Both the volume of the virus and the incubation time need to be optimized for different cell lines. For example, if the cells do not look healthy a few hours after the addition of the virus, use 1 mL of virus and 2 mL of fresh medium (DMEM, high glucose (4.5 g/L), sodium pyruvate, 10% FBS, and 1% Pen/Strep) for step 1.2.2. The length of the incubation time in step 1.2.3 can also be reduced. - Aspirate the medium and add 10 mL of fresh medium (DMEM, high glucose (4.5 g/L), sodium pyruvate, 10% FBS and 1% Pen/Strep). Incubate for between 24 to 72 h at 37 °C and 5% CO2.
- Check the expression of H2B-mCherry in cells using an epifluorescence microscope.
NOTE: If the transduction efficiency is low in the cells, the volume of virus in step 2.2 and the incubation time in step 2.3 could be increased.
- Plate the MDA-MB-231 cells at the density of 1 x 10⁵ cells in a 35 mm culture dish.
2. Synchronization of the Cells Stably Expressing H2B-mCherry
- Plate the cells at 50 to 60% confluency, i.e. plate 2 x 10⁴ MDA-MB-231 cells in each well of a 24-well plate.
- Incubate the culture at 37 °C and 5% CO2 for 24 h.
- Replace the growth medium with 0.5 mL of medium (DMEM, high glucose (4.5 g/L), sodium pyruvate, 10% FBS, and 1% Pen/Strep) containing 2 mM thymidine and leave in the incubator for 24 h.
NOTE: Cells exposed to thymidine are arrested at the phase of cell growth (G1)/DNA synthesis (S) transition and throughout S-phase due to the inhibition of DNA synthesis. The length of the incubation time should be varied and optimized for different cell lines. - Release the cells from thymidine exposure by washing them with phosphate buffered saline (PBS) three times. Then, incubate cells in normal cell culture medium (DMEM, high glucose (4.5 g/L), sodium pyruvate, 10% FBS and 1% Pen/Strep) for 5 h.
NOTE: The release of the cells from the thymidine exposure allows the cells to progress to the cell growth (G2)/mitotic (M) phase for cells previously arrested at the G1/S phase, and to the G1 phase for cells previously arrested at the S phase. The length of release time should be varied and optimized for different cell lines. - Block the cells with 250 ng/mL of nocodazole for 12 h.
NOTE: All of the cells exposed to nocodazole are arrested at the G2/M phase. Nocodazole is cytotoxic. Prolonged exposure to nocodazole can cause apoptosis. Adjust the period or concentration of exposure for different cell lines if cell deaths are observed. Cells that are successfully synchronized will exhibit a spherical morphology. - Shake the cells for 45 s to 1 min using an orbital shaker at 150 to 200 rpm.
NOTE: Mitotic cells, which have little adherence to the substrate, will be shaken off during the process. - Remove the medium to extract cells, by pipetting the medium into a centrifuge tube, and then add 0.5 mL of fresh medium (DMEM, high glucose (4.5 g/L), sodium pyruvate, 10% FBS, and 1% Pen/Strep) to each well of the plate.
- Repeat steps 2.6 and 2.7 three times.
- Centrifuge the collected medium containing the mitotic cells at 800 x g for 3 min.
NOTE: This step is used to remove the nocodazole from the cell medium.
3. Incorporation of the Synchronized Cells into the Collagen I Matrices
NOTE: Type I collagen is the most abundant protein in the human body and in the ECM of connective tissues, and thus is widely used to investigate how eukaryotic cell functions are modulated by a 3D environment17,23,24. Collagen is soluble in acetic acid. After neutralizing and warming the collagen solution to 20 – 37 °C, collagen monomers polymerize into a meshwork of collagen fibrils.
- Prepare the 10x DMEM solution by dissolving a packet of DMEM powder, 3.7 g of sodium bicarbonate (NaHCO3) and 1 g of 4-(2-hydroxyethyl)-1-piperazineethanesulfonic acid (HEPES) in 50 mL of distilled water. Filter the solution, and then prepare 1 M of sodium hydroxide (NaOH) by dissolving 2 g of NaOH pellets in 50 mL of distilled water. Filter and aliquot the solution into 1.5 mL centrifuge tubes.
NOTE: Normal DMEM solution should not be used in this step. The addition of significant volume of the collagen solution will dilute the medium. Therefore the concentrated DMEM solution is prepared to ensure that the final concentration of DMEM in the collagen matrix will be the same as the normal DMEM. - Continue to work with the cells collected from step 2.9. Aspirate the medium, and re-suspend cells in about 0.25 – 0.5 mL of fresh cell culture medium (DMEM, high glucose (4.5 g/L), sodium pyruvate, 10% FBS, and 1% Pen/Strep).
NOTE: To reach a specific cell density in the collagen matrix, the initial density of the cells in the suspension cannot be too low. Thus, the volume of the medium used to re-suspend the cells will depend on the total number of available cells. - Place 10 µL of the re-suspended cell solution from step 3.2 on a hemocytometer and count the density of the cells in the solution.
- Determine the volumes needed for all components to make the 3D collagen matrix. 500 µL of 2 µg/µL collagen gel is used here as an example.
- Calculate the volume of the cell solution needed to obtain 40,000 cells/mL (or 20,000 cells for the 500 µL of collagen gel). This number in µL is X. 50 µL of 10x DMEM will be needed. 50 µL of FBS will be needed.
- Calculate the volume of collagen I stock needed. The concentration of collagen I is around 4 µg/µL. The amount of collagen needed in µL is Y.
- Calculate the volume of sodium hydroxide need to neutralize the acetic acid in the collagen solution: Y µL collagen * 0.023 * 1000 = Z µL NaOH needed.
- Determine the volume of the filler solution: (500 µL total gel – X µL cells – 50 µL 10X DMEM – 50 µL of FBS – Y µL collagen – Z µL NaOH) = R µL
NOTE: The filler solution is distilled water. If the calculated volume of the filler solution is a negative number, the original cell density in the cell suspension is too low. The cells need to be spun down again and re-suspended in a smaller volume of medium (DMEM, high glucose (4.5 g/L), sodium pyruvate, 10% FBS, and 1% Pen/Strep).
- Add the components in the following order to a clean 1.5 mL centrifuge tube: cells in medium, 10x DMEM, FBS, deionized (DI) water, collagen, NaOH. Place all of the components on ice to slow down the gelation of the collagen solution. Use proper pipetting techniques to prevent the formation of bubbles.
- After adding the NaOH, mix the solution carefully with a 1 mL pipet.
NOTE: Gelation of the collagen will start right immediately after the addition of NaOH. Mixing should be done carefully and quickly. - Once the solution is well mixed, add 500 µL of the solution to each well of the 24-well plate. Place the 24-well plate in the 37 °C incubator. Place fresh cell culture medium in the 37 °C water bath.
NOTE: Plastic bottom plates are used for low-magnification live-cell microcopy in which the working distance of the lens is above 1 mm. Glass bottom plates are used for high-magnification live-cell microscopy due to the short working distance of the high magnification lens. - Add 500 µL of pre-warmed medium (DMEM, high glucose (4.5 g/L), sodium pyruvate, 10% FBS and 1% Pen/Strep) to the top of the gel 30 min after completing step 3.7.
4. Live Cell Imaging of the Cells Dividing in the 3D Collagen Matrices (Low Magnification)
NOTE: Images of cells are collected at 2 min intervals using a charge coupled device (CCD) camera mounted on a phase contrast microscope that is equipped with a 10X objective and controlled by imaging software.
- Turn on the live cell unit mounted on top of the objective lens. Wait until the temperature stabilizes at 37 °C, the concentration of CO2 is at 5% and the humidity is at 75%.
- Put the 24-well plate of gels into the live cell unit on the microscope. Find the bottom of the plate and then move the objective lens up until the microscope focuses at about 500 µm from the bottom of the plate.
NOTE: Cells in the collagen matrix that are too close to the bottom of the plate are not completely embedded in the 3D matrix. Imaging cells that are 500 µm away from the bottom of the plate will ensure that the cells are not affected by edge effects16,17,25. - Move the stage around to find the cells, and select multiple positions for imaging.
- Set up the time-lapse experiment at 2-min intervals.
NOTE: The maximum number of positions that can be taken during the 2 min interval is limited by the moving speed of the motorized stage, and the length of the exposure time for capturing images.
5. Collagen Network Deformation During Cell Division (High Magnification Microscopy)
- Turn on the live cell unit mounted on top of the objective lens. Wait until the temperature stabilizes at 37 °C, the concentration of CO2 is at 5% and the humidity is at 75%.
- To visualize collagen fibers in unstained 3D collagen matrices, configure a confocal microscope to capture only reflected light (488-nm) from the 488-nm laser used to illuminate the sample. The laser uses a 60X water-immersion objective, NA = 1.2, WD = 200 µm, and is controlled by imaging software.
- Put the sample (cells in collagen matrices) into the live cell unit. Find the bottom of the plate and then move the objective lens up until the microscope focuses at about 100 µm from the bottom of the plate. Imaging cells that are 100 µm away from the bottom of the plate will ensure that the cells are not affected by edge effects.
NOTE: Here a water-immersion objective is used instead of an oil-immersion lens because the working distance of the oil-immersion lens is only about 100 µm. The use of the oil-immersion lens poses a problem as the thickness of the glass on the bottom of the plate is normally about 100 µm. - Move the stage around to find the cells, and select multiple positions for imaging.
NOTE: Confocal microscopy optically sections the sample and only captures signals from the focal plane. Live cells might be moving in and out of focus during the time-lapse experiment. To enable the capturing of cell images over long periods of time, Z-stack is used to collect images from successive slices at 5 µm intervals. A total of 5 slices spanning 25 µm are imaged. - Set up the time-lapse experiment at 5 min intervals.
NOTE: 5 minutes is used here as the interval instead of 2 min used in section 4 because multiple scanning modes, including fluorescence scanning for H2B-mCherry, reflection scanning for collagen, and Z-stack scanning, are applied to each position. The use of multiple scanning modes reduces the speed of scanning a position when compared to the low magnification imaging. - Quantify the deformation of the collagen matrix in the vicinity of a cell due to the forces exerted by that cell using particle imaging velocimetry (PIV) with sub-pixel resolution20. Performing this analysis on 2D images allows for the clear visualization of both the signals of the H2B-mCherry and the collagen fibers. Apply the anisotropic low pass filtering to enhance the signal of the collagen network20.
- In order to measure the local displacement of a sub-image region of interest located at (x,y) from frame k to frame k+1, extract a regional window of 15×15 pixels centered at (x,y) at frame k. Then identify the best matching locations (x,y)* through the locations that feature a maximum normalized cross-correlation coefficient in the image obtained at frame k+1. The deformation vector is calculated as (x,y)* – (x,y).
Representative Results
The goal of this article is to present an imaging-based method to study mammalian cell division processes in 3D matrices, and to quantify the interactions between the cell and the 3D extracellular matrix during and after cell division. To facilitate the imaging of cell mitosis, we incorporated H2B-mCherry into MDA-MB-231 cells using lentiviral transduction. H2B conjugated with fluorescent proteins is used as a mitotic marker to distinguish mitotic cells from interphase cells, and to define different stages during cell mitosis19,20,26. Using this method, we were able to monitor the entire division process of MDA-MB-231 cells stably expressing H2B-mCherry in 3D collagen matrices (Figure 1A). Mitotic phases started with the dissolution of the nuclear membrane (prophase; frame 1, Figure 1A); the re-organization of the chromosomes (prometaphase: frame 2); the alignment of the chromosomes in the middle of the cell body (metaphase; frame 3); the separation of the chromosomes (anaphase; frame 4); the reorganization of the chromosomes and nuclear membrane, and the separation of the bodies of the two daughter cells (telophase/cytokinesis, frame 5).
The proliferation rate of cells in a 3D matrix is usually much lower than their counterparts on a 2D substrate, which renders the monitoring of cell division in 3D less efficient19. To increase the efficiency of studying 3D cell division, we employed a method combining thymidine, nocodazole, and a shake-off technique to synchronize and select MDA-MB-231 cells that are at the mitotic phase. Synchronized cells were then embedded into collagen matrices. The division process of multiple cells was monitored in real-time using live-cell imaging at 10X magnification. About 70% of the cells divided within the first 2 h after the formation of collagen matrix (Figure 2), thus allowing for efficient monitoring of mitosis in 3D (Figure 2).
To monitor the interaction between cells and their surrounding collagen matrices, we combined confocal reflection microscopy to image collagen fibers, and fluorescence microscopy to image the cells. A 60X lens allows for the capture of high-quality images of collagen fibers. Imaging using a high-magnification lens, which captures fewer cells in each field of view, is much lower-throughput compared to the use of low-magnification at 10X or 20X. Successful synchronization of the cells greatly enhances the efficiency and throughput of such an experiment, since most of the synchronized cells divide within the first 2 h after the formation of the collagen matrix. The matrix deformation during and after cell division is visualized (representative snapshots are shown in Figure 1B) and quantified using a custom PIV software. We quantified and compared matrix deformation during interphase and mitotic phase for cells synchronized into the mitotic phase. We observed that matrix deformation changed very little during the mitotic phase (Figure 3A), and is less than the deformation observed in post-mitotic phases (Figure 3B). This result shows that mammalian cells have minimal attachment and interactions with the surrounding matrix while they are in the mitotic phase.
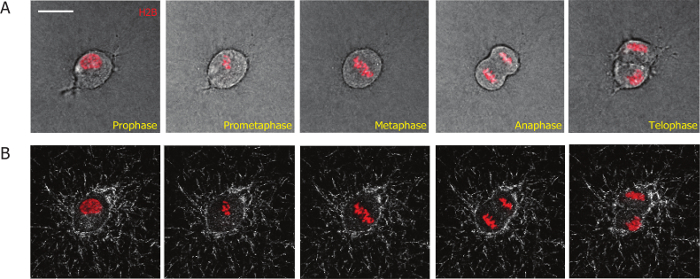
Figure 1: Representative micrographs obtained from a high-magnification live-cell imaging video of a MDA-MB-231 cell embedded in a collagen matrix that stably expresses H2B-mCherry. (A) Different phases of the mitotic progression of the MDA-MB-231 cell are defined by H2B-mCherry as labeled in red. (B) The collagen fibers (white) during the mitotic process are visualized by time-dependent confocal reflection microscopy. Scale bar = 20 µm. Please click here to view a larger version of this figure.
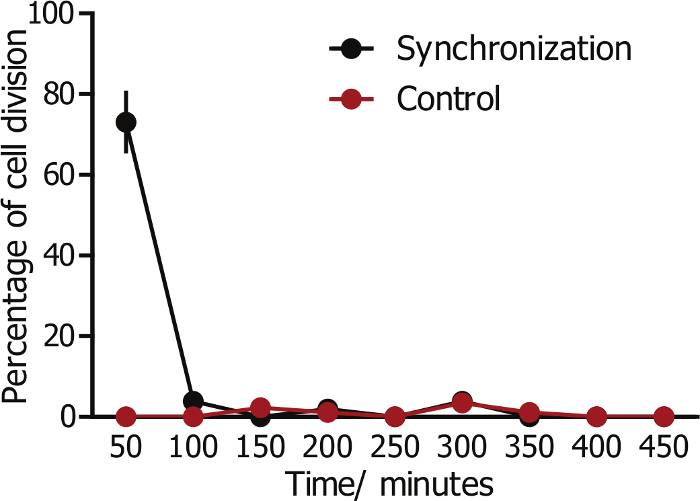
Figure 2: Division of the synchronized cells in 3D collagen matrices. Cells were synchronized to G2/M phase and embedded in a collagen matrix. About 70% of synchronized cells divide within the first 2 h, whereas control cells without synchronization divide randomly. Error bar = SEM (standard error of the mean). Please click here to view a larger version of this figure.
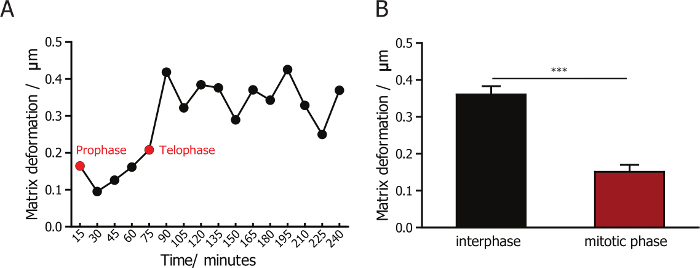
Figure 3: Quantification of the matrix deformation for MDA-MB-231 cells during interphase and mitosis. (A) The change in the magnitude of matrix deformation for matrix-embedded MDA-MB-231 cells. The green arrow indicates prophase and red arrow indicates telophase. (B) Quantification of matrix deformation for MDA-MB-231 cells during interphase and mitotic phase, indicating that matrix deformation is minimal during cell division. Error bar = SEM (standard error of the mean). * p <0.05. Please click here to view a larger version of this figure.
Discussion
The previous study of cell division in 3D was not efficient due to experimental limitations and technical challenges18,19. The critical steps for efficient study of mammalian cell division in 3D collagen matrices are: (1) the incorporation of fluorescence-labeled mitotic markers to the cells; (2) the synchronization of cell division; and (3) the monitoring of division events in 3D matrices using live-cell imaging technique, time-resolved confocal reflection microscopy, and quantitative imaging analysis.
Mitotic cells on 2D substrates can be distinguished from the interphase cells based on their morphology, i.e. mitotic cells are round and barely attach to the substrate whereas interphase cells spread out and attach firmly to the substrate. In 3D matrices, however, the cell morphology is not a reliable marker for mitotic cells since some cells barely spread out and remain round in the matrix27,28. Thus, it is essential to introduce a mitotic marker to the cells for the study of cell division in 3D matrices. We stably expressed H2B-mCherry in MDA-MB-231 cells, which served as a reliable marker for different mitotic phases including prophase, prometaphase, metaphase, anaphase, and telophase/cytokinesis. We previously used this approach to distinguish mitotic cells from interphase cells in 3D matrices. With the help of this marker, we were also able to measure the length of the mitotic phase for another cell line, HT1080 cells, dividing on 2D substrates and in 3D matrices19.
There are multiple ways to synchronize cells, including serum starvation29, mitotic shake-off30,31, double thymidine blocking32, and nocodazole32. We combined the thymidine treatment and the nocodazole treatment to efficiently synchronize MDA-MB-231 cells to the G2/M phase. Cells exposed to thymidine are arrested at the G1/S transition and throughout S phase due to the inhibition of DNA synthesis by thymidine. The release of the cells from the thymidine exposure let the cells progress to G2/M phase for cells arrested at G1/S phase, and to G1 for cells arrested at S phase. All the cells exposed to nocodazole are arrested at the G2/M phase. The rounded-up cells entering mitotic phase were then shaken-off from the plate and directly encapsulated into the collagen matrices. We showed that about 70% of the cells divide within 2 h after they are incorporated into the collagen matrices (Figure 2). Alternatively, cells could be embedded in collagen matrices before synchronization, however, the cross-linked network of the collagen matrix presents a physical barrier and reduces the rate of biomolecular diffusion and convection33,34. Indeed, we attempted to synchronize cells in collagen matrices using thymidine and nocodazole, but failed to obtain efficient synchronization. This result might be due to the inefficient diffusion and convection of the drugs through the collagen matrix.
Reflection is an intrinsic optical property of many biopolymers, including collagen. The confocal reflection microscopy technique visualizes and quantitates the microtopography of porous biomaterials prepared from synthetic polymers and 3D collagen matrices23,24,35,36,37. In our lab, we have established techniques to monitor changes in collagen fiber polarity as the concentration of collagen varies38. Here, we describe the method to monitor the deformation of collagen fibers based on the time-lapse video of the reflective confocal images to denote the cell-matrix interaction. The representative results presented here show that the matrix deformation for the mitotic MDA-MB-231 cells is significantly smaller than those cells in interphase, which suggests that mammalian cells have minimal attachment and interactions with the surrounding matrix when they enter the mitotic phase19.
Previously, we used confocal reflection microscopy to monitor and quantify cell-matrix interaction before, during and after the mitosis of HT1080 cells. We also monitored the matrix deformation by β1-integrin knock-down HT1080 cells during both interphase and mitotic phase. Depleting β1-integrin significantly reduces the matrix deformation by the cell during interphase. However, there is no difference in matrix deformation during the mitotic phase of the round β1-integrin knockdown (KD) cells and the HT1080 wild type cells19.
An alternative approach to visualize collagen fibers is to employ fluorescence-conjugated type I collagen. We previously used this approach to image tracks in the collagen matrices generated by cells19. This approach, however, requires the labeling of collagen with fluorescent dye such as fluorescein isothiocyanate (FITC), which is both time consuming and less efficient. On the other hand, confocal reflection microscopy can be directly applied to unmodified collagen to save time and resources, and exclude the issues associated with fluorescence photobleaching. Moreover, this method does not require an individual fluorescent channel, and is therefore compatible with all fluorescent dyes.
The method presented in this paper can be potentially applied to any type of mammalian cells that divide in a 3D collagen matrix. The incorporation of the H2B-mCherry marker into other mammalian cells by lentiviral transduction will follow exactly the same procedures as described in the paper, although different types of cells may have varied efficiencies for transduction by lentivirus39. Both the density of the cells upon transduction and the titer of the virus could be optimized for efficiency. If high transduction efficiency cannot be achieved, cells could be selected by fluorescence assisted cell sorting (FACS). Thymidine blocking and nocodazole are applied to successfully synchronize several other types of mammalian cells, such as HeLa40. Mechanical shake-off could be applied to any cell types that round up and barely attach to the substrate during the mitotic phase30,31. Moreover, the imaging of collagen fibers using confocal reflection microscopy, and the quantification of the matrix deformation can be directly applied to all other types of dividing mammalian cells.
The method presented here is an efficient and general approach to study mammalian cell division and cell-matrix interactions in a 3D environment. The approach facilitates our probe into the molecular basis of the development of normal tissue and diseases, and potentiates the design of novel diagnostic and therapeutic approaches in the future.
Disclosures
The authors have nothing to disclose.
Acknowledgements
This work was supported by NIH grants R01CA174388 and U54CA143868. The authors would like to acknowledge the PURA award from the Johns Hopkins University for support of Wei-tong Chen. This material is based upon work supported by the National Science Foundation Graduate Research Fellowship under Grant No. 1232825.
Materials
| Human embryonic kidney 293T | ATCC | ||
| MDA-MB-231 | Physical Sciences Oncology Center, NIH | ||
| DMEM | Corning | 10-013-CV | |
| DMEM powder | ThermoFisher Scientific | 12100-046 | |
| Fetal bovine serum | Hyclone | SH30910.03 | |
| Penicillin-Streptomycin 100X | Sigma-Aldrich | P0781 | |
| Fugene HD | Promega | E2311 | |
| Lipofectamine 2000 | Life technologies | 11668-07 | |
| Plasmid encoding H2B-mCherry in a lentiviral vector | Addgene | plasmid 21217 | |
| Thymidine | Sigma-Aldrich | T1895 | |
| Nocodazole | Sigma-Aldrich | M1404 | |
| Opti-MEM | Life Technologies | 31985-070 | |
| Sodium bicarbonate | GibcoBRL | 11810-025 | |
| HEPES | Sigma-Aldrich | 113375-100 | |
| Collagen | Corning | 354236 | |
| NaOH | J.T. Bake | 3722-01 | |
| Millex-HV syringe filter unit, 0.45-μm, PVDF, 33 mm | Millipore | SLHVM33RS | |
| Nikon TE2000E epifluorescence microscope | Nikon | TE2000E | |
| Cascade 1K CCD camera | Roper Scientific | ||
| NIS-Elements AR imaging software | Nikon | ||
| Nikon A1 confocal microscope | Nikon | A1 |
References
- Ly, D. H., Lockhart, D. J., Lerner, R. A., Schultz, P. G. Mitotic misregulation and human aging. Science. 287 (5462), 2486-2492 (2000).
- Gascoigne, K. E., Taylor, S. S. How do anti-mitotic drugs kill cancer cells?. J Cell Sci. 122 (Pt 15), 2579-2585 (2009).
- Brinkley, B. R. Managing the centrosome numbers game: from chaos to stability in cancer cell division. Trends Cell Biol. 11 (1), 18-21 (2001).
- Phillip, J. M., Aifuwa, I., Walston, J., Wirtz, D. The Mechanobiology of Aging. Annu Rev Biomed Eng. 17, 113-141 (2015).
- Hanahan, D., Weinberg, R. A. Hallmarks of cancer: the next generation. Cell. 144 (5), 646-674 (2011).
- Martin, M. D., et al. Effect of ablation or inhibition of stromal matrix metalloproteinase-9 on lung metastasis in a breast cancer model is dependent on genetic background. Cancer Res. 68 (15), 6251-6259 (2008).
- Knox, J. J., Hotte, S. J., Kollmannsberger, C., Winquist, E., Fisher, B., Eisenhauer, E. A. Phase II study of Triapine in patients with metastatic renal cell carcinoma: a trial of the National Cancer Institute of Canada Clinical Trials Group (NCIC IND.161). Invest New Drugs. 25 (5), 471-477 (2007).
- Komlodi-Pasztor, E., Sackett, D. L., Fojo, A. T. Inhibitors targeting mitosis: tales of how great drugs against a promising target were brought down by a flawed rationale. Clin Cancer Res. 18 (1), 51-63 (2012).
- Tong, W. G., et al. Phase I and pharmacologic study of SNS-032, a potent and selective Cdk2, 7, and 9 inhibitor, in patients with advanced chronic lymphocytic leukemia and multiple myeloma. J Clin Oncol. 28 (18), 3015-3022 (2010).
- Matulonis, U. A., et al. Phase II study of MLN8237 (alisertib), an investigational Aurora A kinase inhibitor, in patients with platinum-resistant or -refractory epithelial ovarian, fallopian tube, or primary peritoneal carcinoma. Gynecol Oncol. 127 (1), 63-69 (2012).
- Boss, D. S., et al. Clinical evaluation of AZD1152, an i.v. inhibitor of Aurora B kinase, in patients with solid malignant tumors. Ann Oncol. 22 (2), 431-437 (2011).
- Griffith, L. G., Swartz, M. A. Capturing complex 3D tissue physiology in vitro. Nat Rev Mol Cell Biol. 7 (3), 211-224 (2006).
- Cukierman, E., Pankov, R., Stevens, D. R., Yamada, K. M. Taking cell-matrix adhesions to the third dimension. Science. 294 (5547), 1708-1712 (2001).
- Lu, P., Weaver, V. M., Werb, Z. The extracellular matrix: a dynamic niche in cancer progression. J Cell Biol. 196 (4), 395-406 (2012).
- Giri, A., et al. The Arp2/3 complex mediates multigeneration dendritic protrusions for efficient 3-dimensional cancer cell migration. FASEB J. 27 (10), 4089-4099 (2013).
- Fraley, S. I., Feng, Y., Giri, A., Longmore, G. D., Wirtz, D. Dimensional and temporal controls of three-dimensional cell migration by zyxin and binding partners. Nat Commun. 3, 719 (2012).
- Fraley, S. I., et al. A distinctive role for focal adhesion proteins in three-dimensional cell motility. Nat Cell Biol. 12 (6), 598-604 (2010).
- Lesman, A., Notbohm, J., Tirrell, D. A., Ravichandran, G. Contractile forces regulate cell division in three-dimensional environments. J Cell Biol. 205 (2), 155-162 (2014).
- He, L., et al. Local 3D matrix confinement determines division axis through cell shape. Oncotarget. 7 (6), 6994-7011 (2016).
- Held, M., et al. CellCognition: time-resolved phenotype annotation in high-throughput live cell imaging. Nat Methods. 7 (9), 747-754 (2010).
- Fallica, B., Maffei, J. S., Makin, G., Zaman, M. Alteration of cellular behavior and response to PI3K pathway inhibition by culture in 3D collagen gels. PLoS One. 7 (10), e48024 (2012).
- Meli, L., Jordan, E. T., Clark, D. S., Linhardt, R. J., Dordick, J. S. Influence of a three-dimensional, microarray environment on human Cell culture in drug screening systems. Biomaterials. 33 (35), 9087-9096 (2012).
- Artym, V. V., Matsumoto, K. Imaging cells in three-dimensional collagen matrix. Curr Protoc Cell Biol. 10, 1-20 (2010).
- Gunzer, M., Kampgen, E., Brocker, E. B., Zanker, K. S., Friedl, P. Migration of dendritic cells in 3D-collagen lattices. Visualisation of dynamic interactions with the substratum and the distribution of surface structures via a novel confocal reflection imaging technique. Adv Exp Med Biol. 417, 97-103 (1997).
- Geraldo, S., Simon, A., Vignjevic, D. M. Revealing the cytoskeletal organization of invasive cancer cells in 3D. J Vis Exp. (80), e50763 (2013).
- Lleres, D., James, J., Swift, S., Norman, D. G., Lamond, A. I. Quantitative analysis of chromatin compaction in living cells using FLIM-FRET. J Cell Biol. 187 (4), 481-496 (2009).
- Poincloux, R., et al. Contractility of the cell rear drives invasion of breast tumor cells in 3D Matrigel. Proc Natl Acad Sci U S A. 108 (5), 1943-1948 (2011).
- Carey, S. P., Kraning-Rush, C. M., Williams, R. M., Reinhart-King, C. A. Biophysical control of invasive tumor cell behavior by extracellular matrix microarchitecture. Biomaterials. 33 (16), 4157-4165 (2012).
- Langan, T. J., Chou, R. C. Synchronization of mammalian cell cultures by serum deprivation. Methods Mol Biol. 761, 75-83 (2011).
- Jackman, J., O’Connor, P. M. Methods for synchronizing cells at specific stages of the cell cycle. Curr Protoc Cell Biol. 8, (2001).
- Zwanenburg, T. S. Standardized shake-off to synchronize cultured CHO cells. Mutat Res. 120 (2-3), 151-159 (1983).
- Harper, J. V. Synchronization of cell populations in G1/S and G2/M phases of the cell cycle. Methods Mol Biol. 296, 157-166 (2005).
- Kihara, T., Ito, J., Miyake, J. Measurement of biomolecular diffusion in extracellular matrix condensed by fibroblasts using fluorescence correlation spectroscopy. PLoS One. 8 (11), e82382 (2013).
- Ramanujan, S., et al. Diffusion and convection in collagen gels: implications for transport in the tumor interstitium. Biophys J. 83 (3), 1650-1660 (2002).
- Harjanto, D., Maffei, J. S., Zaman, M. H. Quantitative analysis of the effect of cancer invasiveness and collagen concentration on 3D matrix remodeling. PLoS One. 6 (9), e24891 (2011).
- Wolf, K., et al. Collagen-based cell migration models in vitro and in vivo. Semin Cell Dev Biol. 20 (8), 931-941 (2009).
- Petroll, W. M. Differential interference contrast and confocal reflectance imaging of collagen organization in three-dimensional matrices. Scanning. 28 (6), 305-310 (2006).
- Fraley, S. I., et al. Three-dimensional matrix fiber alignment modulates cell migration and MT1-MMP utility by spatially and temporally directing protrusions. Sci Rep. 5, 14580 (2015).
- Ikeda, Y., Collins, M. K., Radcliffe, P. A., Mitrophanous, K. A., Takeuchi, Y. Gene transduction efficiency in cells of different species by HIV and EIAV vectors. Gene Ther. 9 (14), 932-938 (2002).
- Ma, H. T., Poon, R. Y. Synchronization of HeLa cells. Methods Mol Biol. 761, 151-161 (2011).
